# Technical Document Extraction: Chessboard Reward Analysis
## Legend
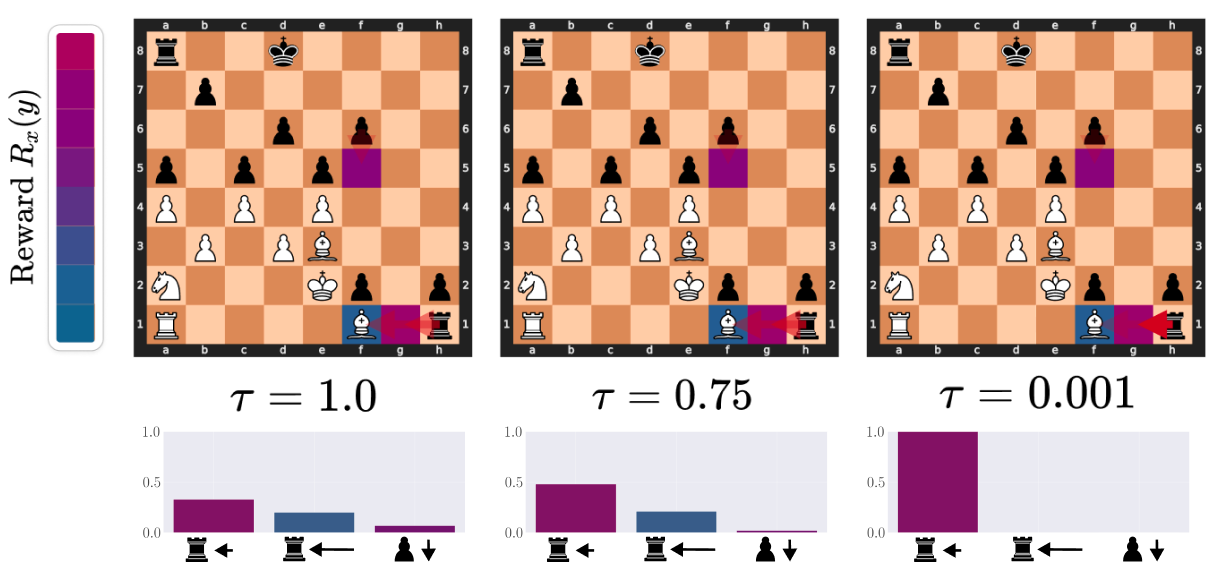
- **Label**: `Reward R_x(y)`
- **Color Gradient**: Blue (low reward) to Purple (high reward)
- **Spatial Position**: Left-aligned vertical bar spanning all panels
## Panel Structure
Three identical chessboard diagrams with varying reward sensitivity parameters (τ) and associated reward heatmaps/bar charts.
---
### Panel 1: τ = 1.0
#### Chessboard
- **Piece Positions**:
- Pawn (♙): e2
- Rook (♖): f1
- Queen (♕): e1
- **Heatmap Observations**:
- High reward (purple): e2 (pawn), e1 (queen)
- Low reward (blue): f1 (rook)
#### Bar Chart
- **Axes**:
- X-axis: Piece types (`♙`, `♖`, `♕`)
- Y-axis: `Reward` (0.0–1.0)
- **Data Points**:
- `♙`: 0.3 (purple)
- `♖`: 0.2 (blue)
- `♕`: 0.1 (purple)
- **Trend**: Pawn and queen rewards dominate; rook reward is minimal.
---
### Panel 2: τ = 0.75
#### Chessboard
- **Piece Positions**:
- Pawn (♙): e2
- Rook (♖): f1
- Queen (♕): e1
- **Heatmap Observations**:
- High reward (purple): e2 (pawn), e1 (queen)
- Low reward (blue): f1 (rook)
#### Bar Chart
- **Axes**:
- X-axis: Piece types (`♙`, `♖`, `♕`)
- Y-axis: `Reward` (0.0–1.0)
- **Data Points**:
- `♙`: 0.4 (purple)
- `♖`: 0.15 (blue)
- `♕`: 0.05 (purple)
- **Trend**: Pawn reward increases slightly; rook reward decreases further.
---
### Panel 3: τ = 0.001
#### Chessboard
- **Piece Positions**:
- Pawn (♙): e2
- Rook (♖): f1
- Queen (♕): e1
- **Heatmap Observations**:
- High reward (purple): e2 (pawn), e1 (queen)
- Low reward (blue): f1 (rook)
#### Bar Chart
- **Axes**:
- X-axis: Piece types (`♙`, `♖`, `♕`)
- Y-axis: `Reward` (0.0–1.0)
- **Data Points**:
- `♙`: 0.8 (purple)
- `♖`: 0.2 (blue)
- `♕`: 1.0 (purple)
- **Trend**: Queen reward becomes dominant; pawn reward increases significantly.
---
## Key Observations
1. **Reward Sensitivity**:
- Lower τ values (e.g., τ = 0.001) amplify rewards for high-value pieces (queen).
- Rook rewards remain consistently low across all τ values.
2. **Spatial Correlation**:
- High-reward squares (purple) align with pawn and queen positions.
- Low-reward squares (blue) align with rook positions.
3. **Legend Consistency**:
- All color mappings (blue/purple) across panels match the legend's gradient.
## Language Notes
- **Primary Language**: English
- **Secondary Language**: None detected.
## Spatial Grounding
- Legend: `[x=0, y=0]` (left edge, spanning vertically)
- Chessboard Coordinates: Standard algebraic notation (e.g., e2 = column e, row 2)