## Composite Chart: Domain Falsification Tests and Action Frequencies
### Overview
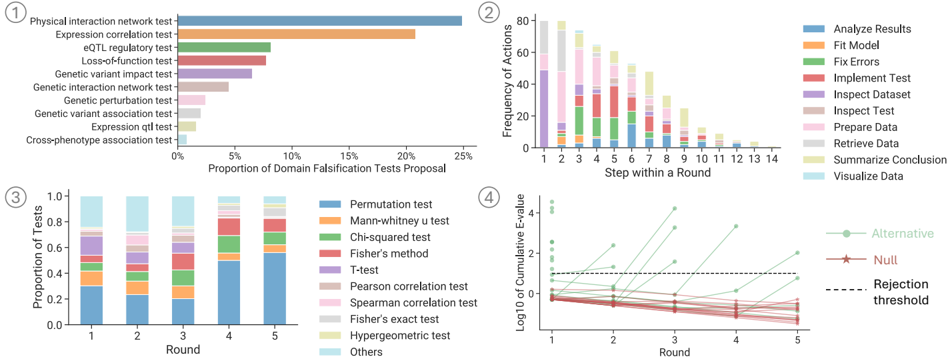
The image presents four charts that analyze different aspects of a domain falsification testing process. Chart 1 shows the proportion of domain falsification tests proposed for various test types. Chart 2 illustrates the frequency of different actions taken at each step within a round. Chart 3 displays the proportion of different statistical tests used in each round. Chart 4 shows the Log10 of cumulative E-value for alternative and null hypotheses across rounds, with a rejection threshold indicated.
### Components/Axes
**Chart 1: Proportion of Domain Falsification Tests Proposal**
* **Type:** Horizontal Bar Chart
* **X-axis:** Proportion of Domain Falsification Tests Proposal (0% to 25%)
* **Y-axis:** Test Types (listed below)
* **Test Types (Y-axis labels):**
* Physical interaction network test
* Expression correlation test
* eQTL regulatory test
* Loss-of-function test
* Genetic variant impact test
* Genetic interaction network test
* Genetic perturbation test
* Genetic variant association test
* Expression qtl test
* Cross-phenotype association test
**Chart 2: Frequency of Actions**
* **Type:** Stacked Bar Chart
* **X-axis:** Step within a Round (1 to 14)
* **Y-axis:** Frequency of Actions (0 to 80)
* **Legend (Right side):**
* Analyze Results (Blue)
* Fit Model (Orange)
* Fix Errors (Green)
* Implement Test (Red)
* Inspect Dataset (Purple)
* Inspect Test (Pink)
* Prepare Data (Light Pink)
* Retrieve Data (Gray)
* Summarize Conclusion (Yellow)
* Visualize Data (Light Blue)
**Chart 3: Proportion of Tests**
* **Type:** Stacked Bar Chart
* **X-axis:** Round (1 to 5)
* **Y-axis:** Proportion of Tests (0.0 to 1.0)
* **Legend (Right side):**
* Permutation test (Blue)
* Mann-Whitney U test (Orange)
* Chi-squared test (Green)
* Fisher's method (Red)
* T-test (Purple)
* Pearson correlation test (Pink)
* Spearman correlation test (Light Pink)
* Fisher's exact test (Gray)
* Hypergeometric test (Yellow)
* Others (Light Blue)
**Chart 4: Log10 of Cumulative E-value**
* **Type:** Line Chart with Scatter Points
* **X-axis:** Round (1 to 5)
* **Y-axis:** Log10 of Cumulative E-value (-2 to 4)
* **Legend (Right side):**
* Alternative (Green line with circle markers)
* Null (Red line with star markers)
* Rejection threshold (Black dashed horizontal line)
### Detailed Analysis
**Chart 1: Proportion of Domain Falsification Tests Proposal**
* Physical interaction network test: ~24%
* Expression correlation test: ~18%
* eQTL regulatory test: ~8%
* Loss-of-function test: ~7%
* Genetic variant impact test: ~6%
* Genetic interaction network test: ~3%
* Genetic perturbation test: ~2%
* Genetic variant association test: ~2%
* Expression qtl test: ~1%
* Cross-phenotype association test: ~0.5%
**Chart 2: Frequency of Actions**
* The frequency of actions decreases as the step within a round increases.
* "Visualize Data" and "Summarize Conclusion" are most frequent in early steps.
* "Analyze Results" is most frequent in the first step.
* "Prepare Data" and "Retrieve Data" are also frequent in early steps.
* "Implement Test" and "Fix Errors" are more frequent in the middle steps.
**Chart 3: Proportion of Tests**
* Permutation tests are the most common test used across all rounds.
* The proportion of permutation tests increases from round 1 to round 5.
* The proportion of "Others" decreases from round 1 to round 5.
* The proportions of other tests fluctuate across rounds.
**Chart 4: Log10 of Cumulative E-value**
* The Log10 of Cumulative E-value for the "Alternative" hypothesis generally increases across rounds.
* The Log10 of Cumulative E-value for the "Null" hypothesis generally decreases across rounds.
* Some "Alternative" hypothesis lines cross the "Rejection threshold" by round 5.
* Most "Null" hypothesis lines remain below the "Rejection threshold."
### Key Observations
* Physical interaction network tests and expression correlation tests are the most frequently proposed domain falsification tests.
* The frequency of actions decreases as the step within a round increases, suggesting a funnel-like process.
* Permutation tests are the most common statistical test used, and their proportion increases over rounds.
* The Log10 of Cumulative E-value for the alternative hypothesis tends to increase, while that of the null hypothesis tends to decrease, indicating a potential shift towards rejecting the null hypothesis in some cases.
### Interpretation
The data suggests a structured approach to domain falsification testing. The distribution of test proposals (Chart 1) indicates a focus on specific types of tests. The decreasing frequency of actions within a round (Chart 2) implies a process that narrows down as it progresses. The increasing use of permutation tests (Chart 3) might reflect their suitability for the data or the specific research question. Finally, the trends in E-values (Chart 4) provide insights into the statistical significance of the findings, with some alternative hypotheses gaining support over rounds. The rejection threshold serves as a benchmark for determining statistical significance.