## [Chart/Diagram Type]: [Brief Title]
### Overview
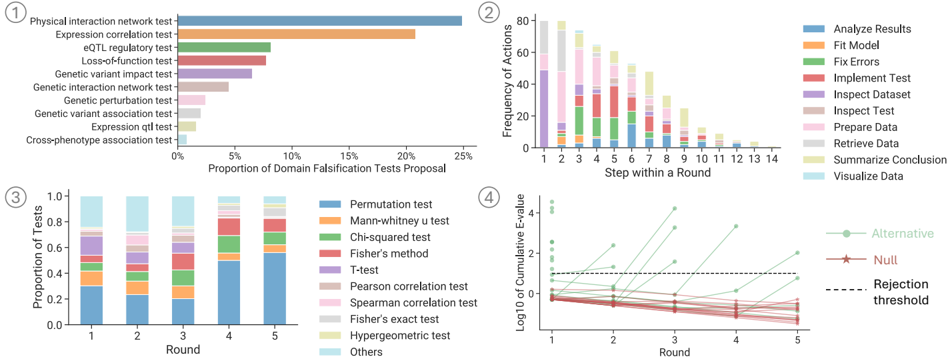
The image displays a collection of four technical diagrams, each representing different aspects of a research or analysis process. The diagrams are labeled as 1, 2, 3, and 4, and they are arranged in a grid format with two rows and two columns.
### Components/Axes
- **Diagram 1**: This bar chart shows the proportion of domain falsification tests proposed for different types of tests. The categories are listed on the x-axis, and the proportion is represented by the height of the bars on the y-axis.
- **Diagram 2**: This bar chart illustrates the frequency of actions taken within a round. The actions are listed on the x-axis, and the frequency is represented by the height of the bars on the y-axis.
- **Diagram 3**: This bar chart displays the proportion of tests completed in each round. The rounds are listed on the x-axis, and the proportion is represented by the height of the bars on the y-axis.
- **Diagram 4**: This line chart shows the cumulative value of a variable over time. The x-axis represents time, and the y-axis represents the cumulative value.
### Detailed Analysis or ### Content Details
- **Diagram 1**: The chart indicates that the majority of domain falsification tests are proposed for genetic variant impact tests, followed by genetic interaction network tests, and then genetic variant association tests. The proportion of tests proposed decreases as we move from genetic variant impact tests to cross-phenotype association tests.
- **Diagram 2**: The chart shows that the frequency of actions taken within a round is relatively high, with the majority of actions occurring in the first few rounds. The frequency of actions decreases as we move to later rounds.
- **Diagram 3**: The chart indicates that the proportion of tests completed is relatively high, with the majority of tests completed in the first few rounds. The proportion of tests completed decreases as we move to later rounds.
- **Diagram 4**: The chart shows that the cumulative value of the variable increases over time, with the rate of increase slowing down as time progresses.
### Key Observations
- The majority of domain falsification tests are proposed for genetic variant impact tests.
- The frequency of actions taken within a round is relatively high.
- The proportion of tests completed is relatively high.
- The cumulative value of the variable increases over time, with the rate of increase slowing down as time progresses.
### Interpretation
The data suggests that the majority of domain falsification tests are proposed for genetic variant impact tests, and that the frequency of actions taken within a round is relatively high. The proportion of tests completed is relatively high, and the cumulative value of the variable increases over time, with the rate of increase slowing down as time progresses. This data could be used to inform future research or analysis processes, and to identify areas for improvement.