## Composite Visualization: Domain Falsification Tests Analysis
### Overview
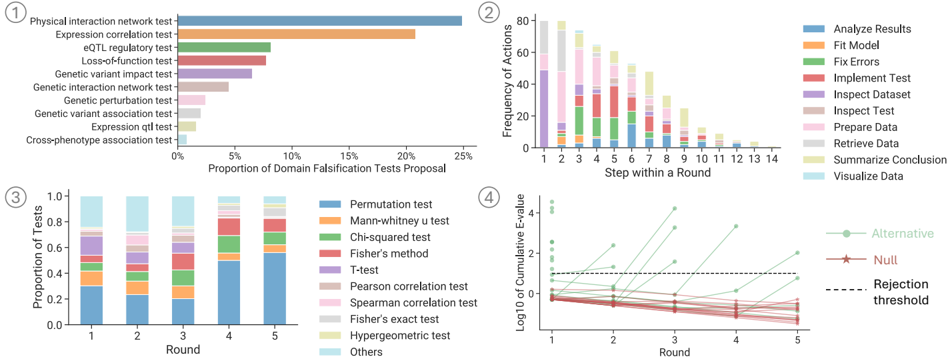
The image contains four subplots analyzing domain falsification tests across multiple dimensions: test proposal frequency, action frequency per round, test type distribution, and statistical significance trends. Each subplot uses distinct visualization techniques to present different aspects of the data.
### Components/Axes
**Subplot 1 (Horizontal Bar Chart):**
- **X-axis:** Proportion of Domain Falsification Tests Proposal (0% to 25%)
- **Y-axis:** Test categories (e.g., Physical interaction network test, Expression correlation test)
- **Legend:** Not explicitly labeled (colors correspond directly to bar colors)
**Subplot 2 (Stacked Bar Chart):**
- **X-axis:** Step within a Round (1 to 14)
- **Y-axis:** Frequency of Actions (0 to 80)
- **Legend:** Right-aligned, mapping colors to actions (e.g., blue = Analyze Results, orange = Fit Model)
**Subplot 3 (Stacked Bar Chart):**
- **X-axis:** Round (1 to 5)
- **Y-axis:** Proportion of Tests (0 to 1.0)
- **Legend:** Right-aligned, mapping colors to statistical tests (e.g., blue = Permutation test, orange = Mann-Whitney U test)
**Subplot 4 (Line Chart):**
- **X-axis:** Round (1 to 5)
- **Y-axis:** Log10 of Cumulative E-value
- **Legend:** Right-aligned, mapping lines to categories (green = Alternative, red = Null, dashed black = Rejection threshold)
### Detailed Analysis
**Subplot 1:**
- Physical interaction network test: ~25% (longest bar)
- Expression correlation test: ~20%
- eQTL regulatory test: ~8%
- Loss-of-function test: ~7%
- Genetic variant impact test: ~6%
- Genetic interaction network test: ~5%
- Genetic perturbation test: ~4%
- Genetic variant association test: ~3%
- Expression QTL test: ~3%
- Cross-phenotype association test: ~2%
**Subplot 2:**
- Step 1: ~80 actions (tallest bar)
- Step 2: ~70 actions
- Step 3: ~60 actions
- Steps 4-14: Gradual decline to ~10 actions
- Dominant actions: Analyze Results (blue), Fit Model (orange), Implement Test (red)
**Subplot 3:**
- Round 1: Permutation test dominates (~0.3), Others (~0.2)
- Round 2: Permutation test (~0.25), Mann-Whitney U (~0.15)
- Round 3: Permutation test (~0.2), Chi-squared (~0.1)
- Round 4: Permutation test (~0.15), Fisher’s method (~0.1)
- Round 5: Permutation test (~0.1), T-test (~0.05)
**Subplot 4:**
- Alternative line: Starts at ~1.5 (Round 1), rises to ~3.5 (Round 5)
- Null line: Flat at ~0.5 across all rounds
- Rejection threshold: Horizontal dashed line at ~2.3
- Lines cross threshold at Round 3 (Alternative) and Round 4 (Null)
### Key Observations
1. Physical interaction network tests are the most frequently proposed (25%).
2. Action frequency decreases significantly after Step 3 in Subplot 2.
3. Permutation tests dominate early rounds but decline in later rounds.
4. Alternative hypothesis line crosses the rejection threshold by Round 3, while Null remains below.
### Interpretation
The data suggests a focus on physical interaction and expression correlation tests in domain falsification proposals. The declining action frequency in later steps may indicate process optimization or reduced complexity. The shift in test types across rounds reflects evolving analytical strategies, with permutation tests giving way to more specific statistical methods. The line chart indicates growing statistical confidence in alternative hypotheses over time, with the Null hypothesis remaining consistently insignificant. This pattern aligns with iterative scientific validation processes where initial broad tests (permutation) transition to targeted analyses (Fisher’s method, T-test) as rounds progress.