## Diagram: Matryoshka Representation Learning
### Overview
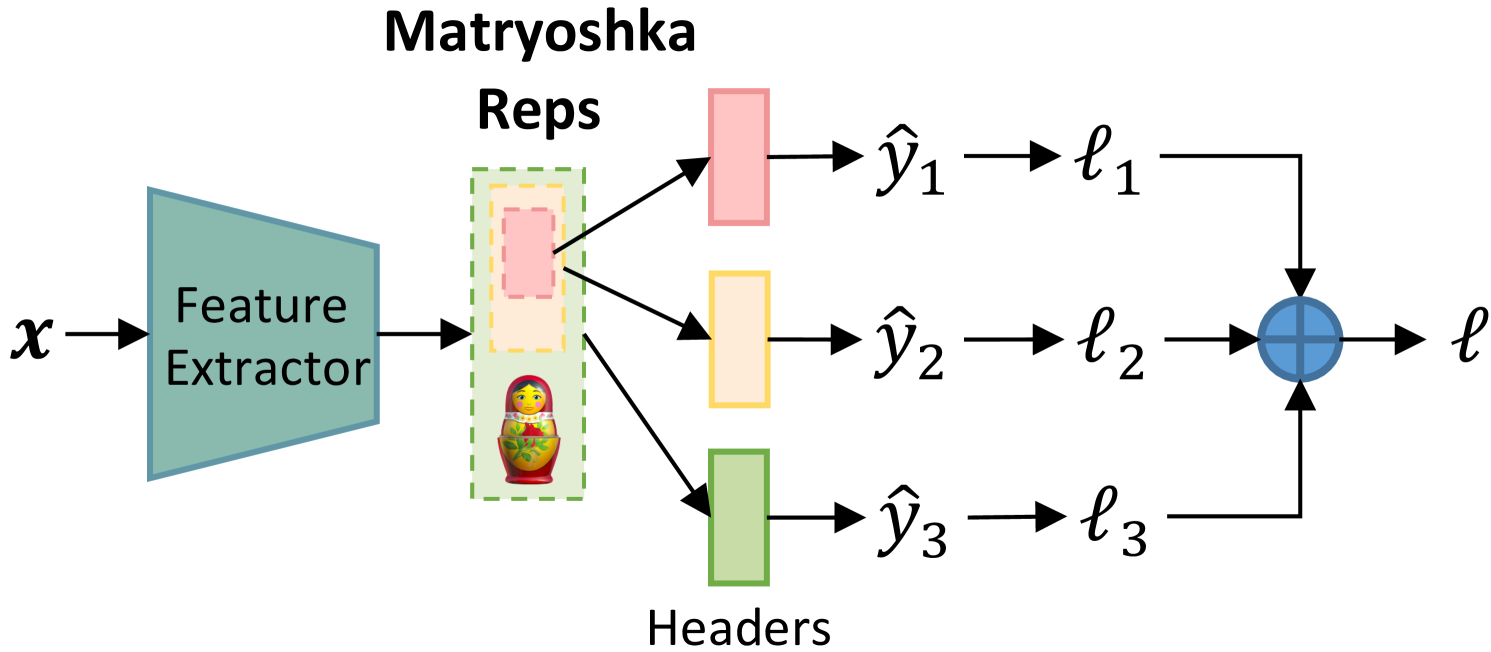
The image is a diagram illustrating a machine learning model architecture, specifically focusing on a "Matryoshka Reps" approach. The diagram shows how an input `x` is processed through a feature extractor, then split into multiple representations, each leading to a separate header and loss calculation, which are then aggregated.
### Components/Axes
* **Input:** `x` (input data)
* **Feature Extractor:** A teal trapezoid labeled "Feature Extractor"
* **Matryoshka Reps:** A dashed green box containing a dashed yellow box, a dashed pink box, and a Matryoshka doll image.
* **Headers:** Three colored rectangles (pink, yellow, green) labeled "Headers" below the green rectangle.
* **Outputs:** `ŷ₁`, `ŷ₂`, `ŷ₃` (predicted outputs)
* **Losses:** `ℓ₁`, `ℓ₂`, `ℓ₃` (individual losses)
* **Aggregated Loss:** `ℓ` (total loss)
* **Aggregation Function:** A blue circle with a plus sign inside, representing the aggregation of individual losses.
### Detailed Analysis
1. **Input `x`:** The input data `x` enters the system from the left.
2. **Feature Extractor:** The input `x` is fed into a "Feature Extractor," which is represented as a teal trapezoid.
3. **Matryoshka Reps:** The output of the feature extractor goes into a "Matryoshka Reps" block. This block contains nested representations, visually represented by nested dashed rectangles (pink inside yellow inside green) and a Matryoshka doll.
4. **Headers:** The output of the "Matryoshka Reps" block is split into three branches, each leading to a different colored "Header":
* Top branch: Pink header leading to `ŷ₁` and `ℓ₁`
* Middle branch: Yellow header leading to `ŷ₂` and `ℓ₂`
* Bottom branch: Green header leading to `ŷ₃` and `ℓ₃`
5. **Outputs and Losses:** Each header produces an output (`ŷ₁`, `ŷ₂`, `ŷ₃`) and a corresponding loss (`ℓ₁`, `ℓ₂`, `ℓ₃`).
6. **Aggregation:** The individual losses (`ℓ₁`, `ℓ₂`, `ℓ₃`) are aggregated using an aggregation function (blue circle with a plus sign) to produce the total loss `ℓ`.
### Key Observations
* The "Matryoshka Reps" block suggests a hierarchical representation learning approach, where different levels of abstraction are captured.
* The use of multiple headers implies that the model is trained to produce multiple outputs or predictions, each associated with a specific representation level.
* The aggregation of individual losses into a total loss indicates that the model is optimized to minimize the overall error across all representation levels.
### Interpretation
The diagram illustrates a machine learning model that leverages hierarchical representations, inspired by the nested structure of Matryoshka dolls. The model extracts features from the input data and then creates multiple representations at different levels of abstraction. Each representation is associated with a separate header, which produces an output and a corresponding loss. The individual losses are then aggregated to train the model. This approach allows the model to learn more robust and generalizable representations by capturing different aspects of the input data. The nested representations within the "Matryoshka Reps" block likely correspond to different levels of granularity or abstraction, enabling the model to capture both fine-grained details and high-level concepts.