\n
## Diagram: Matryoshka Representations Architecture
### Overview
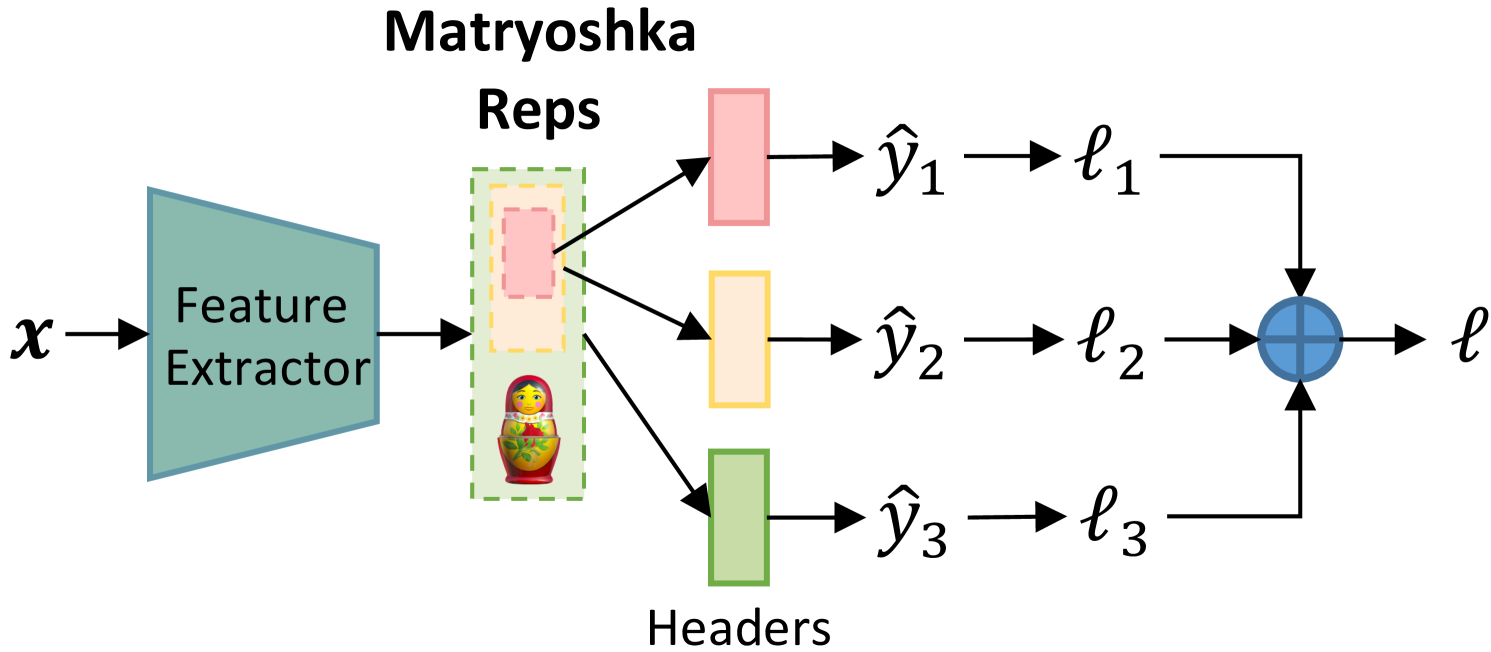
This diagram illustrates the architecture of a "Matryoshka Reps" system, likely a machine learning model. It depicts a feature extraction process followed by a series of representations (ŷ1, ŷ2, ŷ3) and loss calculations (ℓ1, ℓ2, ℓ3) that converge into a final loss function (ℓ). The diagram uses a visual metaphor of Russian nesting dolls (Matryoshka dolls) to represent the hierarchical nature of the representations.
### Components/Axes
The diagram consists of the following components:
* **Input (x):** Represented by a light blue trapezoid.
* **Feature Extractor:** A dark blue rectangle labeled "Feature Extractor".
* **Matryoshka Reps:** A title indicating the overall system.
* **Representations (ŷ1, ŷ2, ŷ3):** Three colored rectangles (pink, yellow, light green) representing different levels of representation.
* **Losses (ℓ1, ℓ2, ℓ3):** Three rectangles (pink, yellow, light green) representing the loss associated with each representation.
* **Final Loss (ℓ):** A white circle representing the combined loss function.
* **Arrows:** Indicate the flow of data and calculations.
* **Nested Doll Image:** A small image of a Matryoshka doll within a dashed green box, visually linking to the "Matryoshka Reps" concept.
* **Headers:** Label at the bottom of the diagram.
### Detailed Analysis / Content Details
The diagram shows a sequential process:
1. **Input (x)** is fed into the **Feature Extractor**.
2. The **Feature Extractor** outputs a set of features, which are then used to generate three representations:
* **ŷ1:** Output from the pink rectangle.
* **ŷ2:** Output from the yellow rectangle.
* **ŷ3:** Output from the light green rectangle.
3. Each representation (ŷi) is associated with a corresponding loss function (ℓi):
* **ℓ1:** Loss associated with ŷ1.
* **ℓ2:** Loss associated with ŷ2.
* **ℓ3:** Loss associated with ŷ3.
4. The individual losses (ℓ1, ℓ2, ℓ3) are combined to produce a final loss function (ℓ), represented by the white circle. The arrows converging into the white circle indicate this combination.
The diagram does not provide any numerical values or specific details about the feature extraction process or the loss functions. It is a high-level architectural overview.
### Key Observations
* The use of nested rectangles and the Matryoshka doll image suggests a hierarchical structure where each representation builds upon the previous one.
* The diagram emphasizes the importance of loss functions in evaluating and refining the representations.
* The flow of information is unidirectional, from input to final loss.
### Interpretation
The diagram likely represents a multi-level representation learning system. The "Matryoshka Reps" name suggests that the representations are nested, with each level capturing increasingly abstract or refined features of the input data. The loss functions (ℓ1, ℓ2, ℓ3) likely serve to optimize each level of representation, while the final loss (ℓ) provides an overall measure of the system's performance. This architecture could be used in various machine learning tasks, such as image recognition, natural language processing, or reinforcement learning, where hierarchical representations are beneficial. The diagram is conceptual and does not provide details about the specific algorithms or parameters used in the system. It is a visual explanation of the overall structure and flow of information.