## Scatter Plot: Response Time vs. Problem Size
### Overview
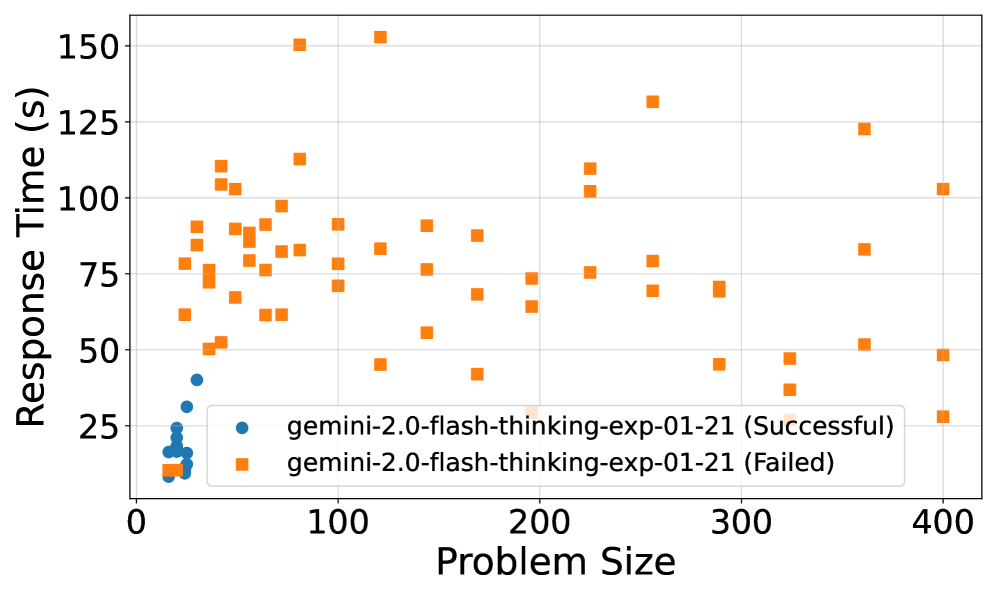
The image is a scatter plot comparing the response time (in seconds) against the problem size for the 'gemini-2.0-flash-thinking-exp-01-21' experiment. The plot distinguishes between successful and failed attempts, with successful attempts marked in blue and failed attempts in orange.
### Components/Axes
* **X-axis:** Problem Size, ranging from 0 to 400. Axis markers are present at 0, 100, 200, 300, and 400.
* **Y-axis:** Response Time (s), ranging from 0 to 150. Axis markers are present at 0, 25, 50, 75, 100, 125, and 150.
* **Legend:** Located in the bottom-right corner.
* Blue circles: 'gemini-2.0-flash-thinking-exp-01-21 (Successful)'
* Orange squares: 'gemini-2.0-flash-thinking-exp-01-21 (Failed)'
### Detailed Analysis
* **Successful Attempts (Blue):**
* All successful attempts are clustered at the lower left of the graph, with problem sizes between 0 and approximately 50.
* Response times for successful attempts range from approximately 5 seconds to 40 seconds.
* Trend: Successful attempts are concentrated at smaller problem sizes and lower response times.
* Specific Data Points:
* (Problem Size ~10, Response Time ~10)
* (Problem Size ~10, Response Time ~15)
* (Problem Size ~10, Response Time ~20)
* (Problem Size ~20, Response Time ~10)
* (Problem Size ~20, Response Time ~25)
* (Problem Size ~30, Response Time ~35)
* (Problem Size ~50, Response Time ~40)
* **Failed Attempts (Orange):**
* Failed attempts are scattered across the plot, with problem sizes ranging from approximately 10 to 400.
* Response times for failed attempts range from approximately 10 seconds to 155 seconds.
* Trend: Failed attempts are more prevalent at larger problem sizes and higher response times, but are present across the entire problem size range.
* Specific Data Points:
* (Problem Size ~10, Response Time ~10)
* (Problem Size ~20, Response Time ~10)
* (Problem Size ~20, Response Time ~15)
* (Problem Size ~20, Response Time ~20)
* (Problem Size ~30, Response Time ~60)
* (Problem Size ~40, Response Time ~80)
* (Problem Size ~50, Response Time ~90)
* (Problem Size ~60, Response Time ~60)
* (Problem Size ~70, Response Time ~90)
* (Problem Size ~80, Response Time ~75)
* (Problem Size ~90, Response Time ~90)
* (Problem Size ~100, Response Time ~75)
* (Problem Size ~110, Response Time ~45)
* (Problem Size ~120, Response Time ~75)
* (Problem Size ~130, Response Time ~75)
* (Problem Size ~140, Response Time ~155)
* (Problem Size ~150, Response Time ~75)
* (Problem Size ~160, Response Time ~75)
* (Problem Size ~170, Response Time ~75)
* (Problem Size ~180, Response Time ~75)
* (Problem Size ~190, Response Time ~75)
* (Problem Size ~200, Response Time ~100)
* (Problem Size ~210, Response Time ~110)
* (Problem Size ~220, Response Time ~75)
* (Problem Size ~230, Response Time ~130)
* (Problem Size ~240, Response Time ~75)
* (Problem Size ~250, Response Time ~75)
* (Problem Size ~260, Response Time ~75)
* (Problem Size ~270, Response Time ~75)
* (Problem Size ~280, Response Time ~75)
* (Problem Size ~290, Response Time ~75)
* (Problem Size ~300, Response Time ~75)
* (Problem Size ~310, Response Time ~75)
* (Problem Size ~320, Response Time ~75)
* (Problem Size ~330, Response Time ~75)
* (Problem Size ~340, Response Time ~75)
* (Problem Size ~350, Response Time ~75)
* (Problem Size ~360, Response Time ~75)
* (Problem Size ~370, Response Time ~75)
* (Problem Size ~380, Response Time ~75)
* (Problem Size ~390, Response Time ~100)
* (Problem Size ~400, Response Time ~30)
### Key Observations
* Successful attempts are limited to smaller problem sizes.
* Failed attempts occur across a wide range of problem sizes and response times.
* There is a clear separation between successful and failed attempts based on problem size.
### Interpretation
The data suggests that the 'gemini-2.0-flash-thinking-exp-01-21' experiment is only successful for smaller problem sizes. As the problem size increases, the experiment is more likely to fail, and the response time tends to be higher. This could indicate a limitation in the algorithm's ability to handle larger, more complex problems within a reasonable time frame. The clustering of successful attempts at low problem sizes and response times indicates a region of efficiency for the algorithm. The scattering of failed attempts suggests that factors beyond just problem size may contribute to failures, as some failures occur even at smaller problem sizes, albeit with longer response times.