\n
## Scatter Plot: Response Time vs. Problem Size for Gemini 2.0 Flash Thinking Experiments
### Overview
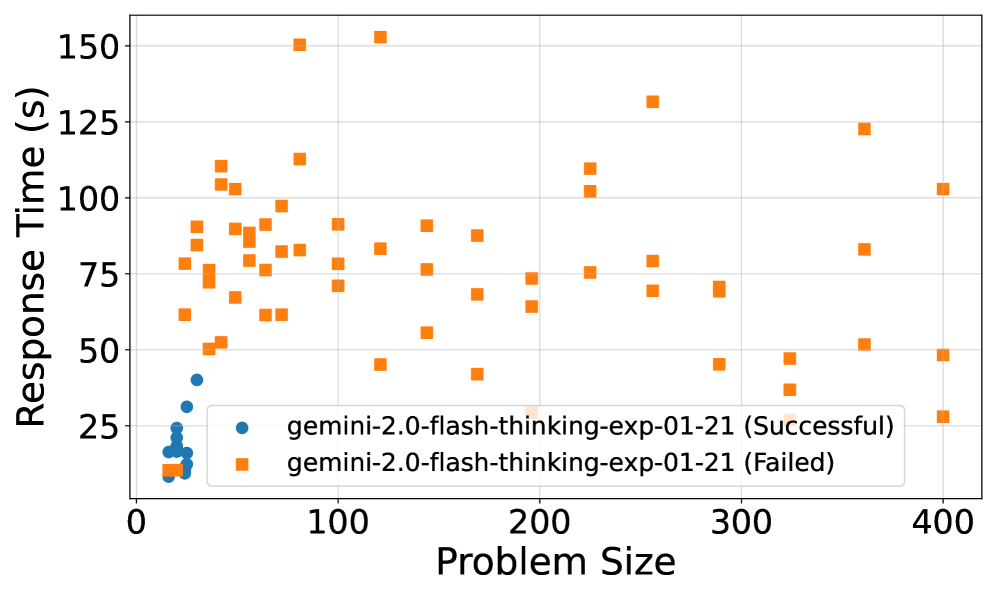
This scatter plot visualizes the relationship between Problem Size and Response Time for two sets of experiments: successful and failed runs of "gemini-2.0-flash-thinking-exp-01-21". The plot displays individual data points representing each experiment's outcome, with color-coding used to distinguish between successful and failed attempts.
### Components/Axes
* **X-axis:** Problem Size (ranging from approximately 0 to 400).
* **Y-axis:** Response Time (s) (ranging from approximately 0 to 160 seconds).
* **Legend:** Located in the bottom-left corner.
* Blue circles: "gemini-2.0-flash-thinking-exp-01-21 (Successful)"
* Orange squares: "gemini-2.0-flash-thinking-exp-01-21 (Failed)"
* **Gridlines:** Light gray horizontal and vertical lines provide a visual reference for data point positioning.
### Detailed Analysis
The plot shows a distribution of data points for both successful and failed experiments.
**Successful Runs (Blue Circles):**
The successful runs exhibit a clear trend: as Problem Size increases, Response Time generally increases, but with significant variability.
* At Problem Size ≈ 0, Response Time ranges from approximately 10s to 30s.
* At Problem Size ≈ 50, Response Time ranges from approximately 20s to 60s.
* At Problem Size ≈ 100, Response Time ranges from approximately 30s to 50s.
* At Problem Size ≈ 200, Response Time ranges from approximately 30s to 60s.
* At Problem Size ≈ 300, Response Time ranges from approximately 30s to 50s.
* At Problem Size ≈ 400, Response Time ranges from approximately 20s to 40s.
**Failed Runs (Orange Squares):**
The failed runs also show a general trend of increasing Response Time with increasing Problem Size, but with a wider range of values and a tendency towards longer response times compared to successful runs.
* At Problem Size ≈ 0, Response Time ranges from approximately 10s to 30s.
* At Problem Size ≈ 50, Response Time ranges from approximately 40s to 120s.
* At Problem Size ≈ 100, Response Time ranges from approximately 50s to 150s.
* At Problem Size ≈ 200, Response Time ranges from approximately 60s to 120s.
* At Problem Size ≈ 300, Response Time ranges from approximately 50s to 130s.
* At Problem Size ≈ 400, Response Time ranges from approximately 80s to 120s.
### Key Observations
* **Response Time Distribution:** Failed runs generally have higher response times than successful runs for the same problem size.
* **Variability:** There is significant variability in response times for both successful and failed runs, suggesting other factors influence performance.
* **Outliers:** Several failed runs exhibit exceptionally long response times (e.g., around Problem Size 100, Response Time ≈ 150s).
* **Overlap:** There is overlap in response times between successful and failed runs, particularly at smaller problem sizes.
### Interpretation
The data suggests that as the problem size increases, the response time for the Gemini 2.0 flash thinking experiments also tends to increase. However, the success or failure of the experiment is strongly correlated with the response time; failed runs consistently exhibit longer response times. This could indicate that exceeding a certain response time threshold leads to experiment failure. The variability in response times suggests that factors beyond problem size influence performance, such as the specific characteristics of the problem instance or the system's current load. The outliers in the failed run data may represent particularly challenging problem instances or instances where the system encountered unexpected issues. The overlap in response times between successful and failed runs at smaller problem sizes suggests that the system can handle smaller problems relatively efficiently, but its performance degrades as the problem size increases. Further investigation is needed to understand the underlying causes of the variability and the factors that contribute to experiment failure.