## Scatter Plot: Response Time vs Problem Size for Gemini-2.0-Flash-Thinking Experiments
### Overview
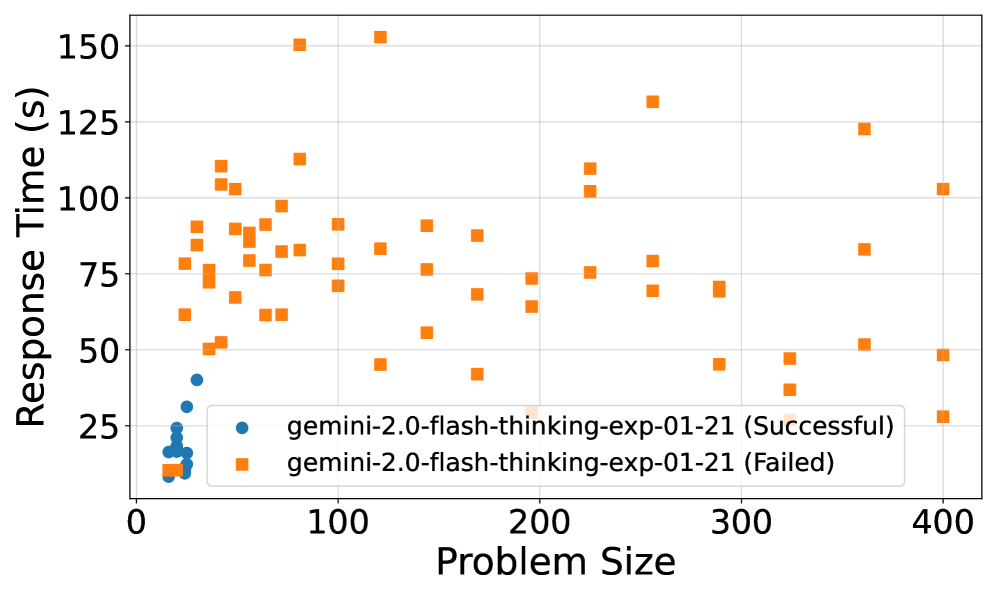
The image is a scatter plot comparing response times (in seconds) to problem sizes for two experimental conditions: "Successful" and "Failed" outcomes from the Gemini-2.0-flash-thinking-exp-01-21 experiment. The plot uses distinct markers (blue circles for successful, orange squares for failed) to differentiate outcomes.
### Components/Axes
- **X-axis (Problem Size)**: Ranges from 0 to 400 in increments of 100.
- **Y-axis (Response Time (s))**: Ranges from 0 to 150 in increments of 25.
- **Legend**: Located in the bottom-left corner, with:
- **Blue circles**: "gemini-2.0-flash-thinking-exp-01-21 (Successful)"
- **Orange squares**: "gemini-2.0-flash-thinking-exp-01-21 (Failed)"
- **Gridlines**: Light gray horizontal and vertical lines for reference.
### Detailed Analysis
1. **Successful Cases (Blue Circles)**:
- **Distribution**: Clustered tightly in the lower-left quadrant.
- **Response Time**: Approximately 10–30 seconds.
- **Problem Size**: Mostly ≤50, with a few outliers up to ~75.
- **Trend**: Response time increases slightly with problem size but remains low overall.
2. **Failed Cases (Orange Squares)**:
- **Distribution**: Spread across the entire plot, with higher density in the upper-right quadrant.
- **Response Time**: Ranges from ~50 to 150 seconds.
- **Problem Size**: Extends up to 400, with a notable concentration between 200–400.
- **Trend**: Response time increases significantly with problem size, especially beyond 200.
3. **Outliers**:
- A single successful case (blue circle) at problem size ~100 and response time ~25 seconds.
- A failed case (orange square) at problem size ~350 and response time ~150 seconds (highest observed).
### Key Observations
- **Problem Size vs. Response Time**: Both successful and failed cases show a positive correlation between problem size and response time, but the relationship is much stronger for failed cases.
- **Success Threshold**: Successful outcomes are predominantly associated with problem sizes ≤75, while failures dominate at larger sizes.
- **Response Time Variability**: Failed cases exhibit greater variability in response times, with some instances exceeding 125 seconds.
### Interpretation
The data suggests that problem size is a critical factor in determining the success of the Gemini-2.0-flash-thinking-exp-01-21 experiment. Successful outcomes are consistently achieved for smaller problem sizes (≤75), with response times remaining efficient (10–30 seconds). As problem size increases beyond 75, the likelihood of failure rises sharply, accompanied by a proportional increase in response time. This implies potential limitations in the model's ability to handle larger inputs efficiently, possibly due to computational constraints or algorithmic complexity. The failed cases at the highest problem sizes (300–400) with response times near 150 seconds may indicate timeouts or resource exhaustion, highlighting a need for optimization or scaling strategies for larger-scale applications.