## Logic Diagram: Fault Tree Analysis
### Overview
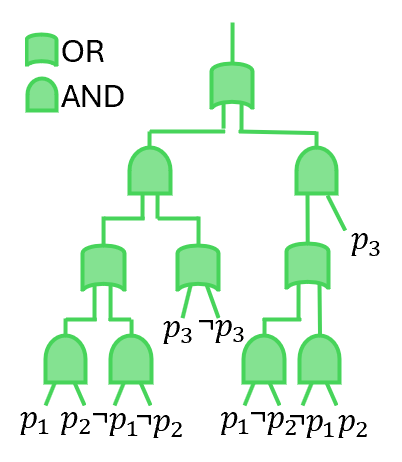
The image presents a fault tree diagram, a top-down, deductive failure analysis used to determine how systems can fail, identify the best ways to reduce risk, and determine (or get a feeling for) event rates of a safety accident or a particular system level (functional) failure. The diagram uses standard logic gate symbols (OR and AND) to represent the relationships between events leading to a top-level event. The diagram is rendered in green.
### Components/Axes
* **Logic Gates:**
* OR Gate: Represented by a curved-bottom symbol. An OR gate indicates that the output event occurs if at least one of the input events occurs.
* AND Gate: Represented by a flat-bottom symbol. An AND gate indicates that the output event occurs only if all input events occur.
* **Events:** Represented by text labels (p1, p2, p3, ¬p1, ¬p2, ¬p3). The '¬' symbol indicates the negation of the event.
* **Legend:** Located in the top-left corner, explaining the symbols for OR and AND gates.
### Detailed Analysis
The fault tree diagram starts with a single output at the top and branches down to the input events at the bottom.
* **Top Level:** A single OR gate at the top.
* **Second Level:** The top OR gate connects to two gates: an AND gate on the left and an OR gate on the right.
* **Third Level (Left Branch):** The AND gate connects to two gates: an AND gate on the left and an OR gate on the right.
* **Third Level (Right Branch):** The OR gate connects to a single event, p3.
* **Fourth Level (Left Branch):** The AND gate connects to two events: p3 and ¬p3.
* **Fourth Level (Right Branch):** The OR gate connects to two gates: an AND gate on the left and an AND gate on the right.
* **Bottom Level:** The bottom level consists of the following events: p1, p2, ¬p1, ¬p2, p1, ¬p2, p1, p2.
### Key Observations
* The diagram uses a combination of OR and AND gates to model the relationships between events.
* The negation symbol (¬) is used to represent the complement of an event.
* The diagram shows how multiple events can combine to cause a top-level event.
### Interpretation
The fault tree diagram is a visual representation of the logical relationships between events that can lead to a system failure. By analyzing the diagram, one can identify the critical events and combinations of events that are most likely to cause the failure. This information can be used to improve system design, implement safety measures, and reduce the risk of failure. The presence of both p3 and ¬p3 in the same branch suggests a potential contradiction or a scenario where both the event and its negation are considered. The repetition of p1, p2, ¬p1, and ¬p2 at the bottom level indicates that these events are fundamental to the overall system failure.