## Heatmap: Pass@1 Performance Across Models and Parameters
### Overview
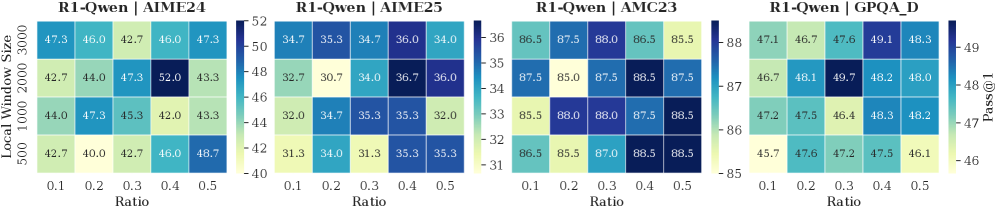
The image presents a heatmap comparing the Pass@1 performance of four different models (R1-Owen | AIME24, R1-Owen | AIME25, R1-Owen | AMC23, and R1-Owen | GPQA D) across varying combinations of 'Ratio' and 'Local Window Size'. The heatmap uses a color gradient to represent the Pass@1 values, with cooler colors (blues) indicating lower performance and warmer colors (yellows/greens) indicating higher performance.
### Components/Axes
* **X-axis:** 'Ratio', ranging from 0.1 to 0.5, with markers at 0.1, 0.2, 0.3, 0.4, and 0.5.
* **Y-axis:** 'Local Window Size', ranging from 500 to 2000, with markers at 500, 1000, 1500, and 2000.
* **Color Scale:** Represents Pass@1 values. The scale ranges from approximately -52 to -88. The color gradient is as follows:
* Dark Blue: ~-88
* Blue: ~-85 to -87
* Light Blue: ~-80 to -84
* Green: ~-70 to -79
* Yellow: ~-60 to -69
* Light Yellow: ~-50 to -59
* **Titles:** Each heatmap is labeled with the model name (e.g., "R1-Owen | AIME24").
* **Four Heatmaps:** Arranged horizontally, each representing a different model.
### Detailed Analysis
Here's a breakdown of the data within each heatmap, noting trends and approximate values.
**1. R1-Owen | AIME24**
* **Trend:** Generally, performance increases with increasing 'Local Window Size' and decreasing 'Ratio'.
* **Data Points (approximate):**
* Ratio 0.1, Window 500: 40.0
* Ratio 0.1, Window 1000: 47.3
* Ratio 0.1, Window 1500: 46.0
* Ratio 0.1, Window 2000: 42.7
* Ratio 0.5, Window 500: 48.7
* Ratio 0.5, Window 1000: 52.0
* Ratio 0.5, Window 1500: 47.3
* Ratio 0.5, Window 2000: 46.7
* Ratio 0.3, Window 1000: 45.3
* Ratio 0.4, Window 1000: 46.7
**2. R1-Owen | AIME25**
* **Trend:** Similar to AIME24, performance generally increases with increasing 'Local Window Size' and decreasing 'Ratio'.
* **Data Points (approximate):**
* Ratio 0.1, Window 500: 34.0
* Ratio 0.1, Window 1000: 35.7
* Ratio 0.1, Window 1500: 34.7
* Ratio 0.1, Window 2000: 32.7
* Ratio 0.5, Window 500: 35.3
* Ratio 0.5, Window 1000: 36.7
* Ratio 0.5, Window 1500: 36.0
* Ratio 0.5, Window 2000: 34.7
* Ratio 0.3, Window 1000: 34.3
* Ratio 0.4, Window 1000: 33.3
**3. R1-Owen | AMC23**
* **Trend:** Performance is generally higher than AIME24 and AIME25. Performance increases with increasing 'Local Window Size' and decreasing 'Ratio'.
* **Data Points (approximate):**
* Ratio 0.1, Window 500: 85.0
* Ratio 0.1, Window 1000: 87.5
* Ratio 0.1, Window 1500: 88.0
* Ratio 0.1, Window 2000: 86.5
* Ratio 0.5, Window 500: 88.5
* Ratio 0.5, Window 1000: 87.0
* Ratio 0.5, Window 1500: 85.0
* Ratio 0.5, Window 2000: 85.5
* Ratio 0.3, Window 1000: 85.0
* Ratio 0.4, Window 1000: 86.5
**4. R1-Owen | GPQA D**
* **Trend:** Performance is generally high, but slightly lower than AMC23. Performance increases with increasing 'Local Window Size' and decreasing 'Ratio'.
* **Data Points (approximate):**
* Ratio 0.1, Window 500: 47.6
* Ratio 0.1, Window 1000: 48.1
* Ratio 0.1, Window 1500: 49.7
* Ratio 0.1, Window 2000: 46.7
* Ratio 0.5, Window 500: 46.1
* Ratio 0.5, Window 1000: 47.2
* Ratio 0.5, Window 1500: 48.0
* Ratio 0.5, Window 2000: 47.6
* Ratio 0.3, Window 1000: 47.5
* Ratio 0.4, Window 1000: 46.4
### Key Observations
* **Model Performance:** R1-Owen | AMC23 consistently exhibits the highest Pass@1 values across all parameter combinations. R1-Owen | AIME25 shows the lowest performance.
* **Parameter Interaction:** For all models, decreasing the 'Ratio' and increasing the 'Local Window Size' generally leads to improved performance.
* **Performance Range:** The Pass@1 values vary significantly across models, ranging from approximately 32 to 88.
### Interpretation
The heatmap demonstrates the impact of 'Ratio' and 'Local Window Size' on the Pass@1 performance of different models. The consistent trend across all models suggests that these parameters play a crucial role in determining the model's ability to correctly answer questions. The superior performance of R1-Owen | AMC23 indicates that this model is more robust to variations in these parameters or benefits more from larger window sizes and lower ratios. The differences in performance between the models highlight the importance of model architecture and training data in achieving high accuracy. The heatmap provides valuable insights for optimizing model parameters and selecting the most appropriate model for a given task. The negative values on the y-axis suggest that the Pass@1 metric is being represented as a loss or error rate, where lower values indicate better performance.