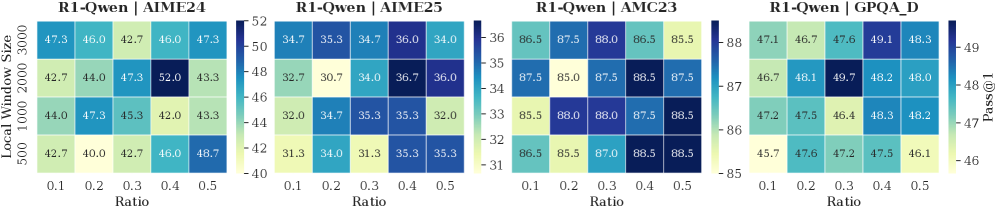
## Heatmap: Model Performance Comparison Across Datasets
### Overview
The image contains four heatmaps comparing the performance of the R1-Qwen model across different datasets (AIME24, AIME25, AMC23, GPQA_D) under varying local window sizes (500, 1000, 2000, 3000) and ratio values (0.1–0.5). Performance is measured using a metric labeled "Pass@1," with color intensity indicating higher/lower values.
---
### Components/Axes
1. **X-Axis (Ratio)**: Discrete values [0.1, 0.2, 0.3, 0.4, 0.5].
2. **Y-Axis (Local Window Size)**: Discrete values [500, 1000, 2000, 3000].
3. **Color Scale (Pass@1)**:
- AIME24: 40.0–52.0 (dark blue = highest).
- AIME25: 31.3–36.0 (dark blue = highest).
- AMC23: 85.0–88.5 (dark blue = highest).
- GPQA_D: 46.1–49.7 (dark blue = highest).
4. **Legend**: Positioned on the right of each heatmap, with a vertical color bar and numerical range.
---
### Detailed Analysis
#### AIME24
- **Key Values**:
- 500 window: 47.3 (0.1), 46.0 (0.2), 42.7 (0.3), 46.0 (0.4), 47.3 (0.5).
- 2000 window: 44.0 (0.1), 47.3 (0.2), 45.3 (0.3), **52.0** (0.4), 43.3 (0.5).
- 3000 window: 42.7 (0.1), 44.0 (0.2), 42.0 (0.3), 46.0 (0.4), 48.7 (0.5).
- **Trend**: Performance peaks at 2000 window size and 0.4 ratio (52.0).
#### AIME25
- **Key Values**:
- 500 window: 32.7 (0.1), 30.7 (0.2), 34.0 (0.3), 35.3 (0.4), 35.3 (0.5).
- 2000 window: **36.0** (0.1), 34.7 (0.2), 35.3 (0.3), 32.0 (0.4), 35.3 (0.5).
- 3000 window: 31.3 (0.1), 34.0 (0.2), 31.3 (0.3), 35.3 (0.4), 35.3 (0.5).
- **Trend**: Highest value at 2000 window and 0.1 ratio (36.0).
#### AMC23
- **Key Values**:
- 500 window: 86.5 (0.1), 87.5 (0.2), 85.5 (0.3), 88.0 (0.4), 86.5 (0.5).
- 2000 window: 87.5 (0.1), **88.5** (0.2), 87.5 (0.3), 88.5 (0.4), 87.5 (0.5).
- 3000 window: 85.5 (0.1), 86.5 (0.2), 85.5 (0.3), 88.5 (0.4), 88.5 (0.5).
- **Trend**: Consistent high performance across all ratios, peaking at 2000/3000 window sizes and 0.2–0.5 ratios.
#### GPQA_D
- **Key Values**:
- 500 window: 47.1 (0.1), 46.7 (0.2), 49.1 (0.3), 48.3 (0.4), 48.0 (0.5).
- 2000 window: 46.7 (0.1), **49.7** (0.2), 48.2 (0.3), 48.0 (0.4), 48.2 (0.5).
- 3000 window: 45.7 (0.1), 47.6 (0.2), 47.2 (0.3), 47.5 (0.4), 46.1 (0.5).
- **Trend**: Peak at 2000 window and 0.2 ratio (49.7).
---
### Key Observations
1. **Window Size Impact**:
- Larger window sizes (2000–3000) generally improve performance across datasets.
- Exceptions: AIME25 shows mixed results with 3000 window size.
2. **Ratio Impact**:
- Higher ratios (0.4–0.5) often correlate with better performance, except in AIME25 (0.1 ratio outperforms).
3. **Dataset Variance**:
- AMC23 consistently achieves the highest scores (85–88.5).
- GPQA_D has the lowest scores (45.7–49.7).
---
### Interpretation
- **Optimal Configuration**: For most datasets, a window size of 2000 and ratio of 0.4–0.5 yields the best results. AMC23 benefits most from larger windows, while AIME25 performs best with smaller windows (500) and low ratios (0.1).
- **Trade-offs**: Larger windows may increase computational cost but improve accuracy. GPQA_D shows diminishing returns with larger windows.
- **Anomalies**: AIME25’s 3000 window size underperforms compared to smaller windows, suggesting potential overfitting or inefficiency at extreme window sizes.
This analysis highlights the importance of tuning window size and ratio based on dataset characteristics to balance performance and resource usage.