\n
## Line Chart: ΔJL vs. Extraction
### Overview
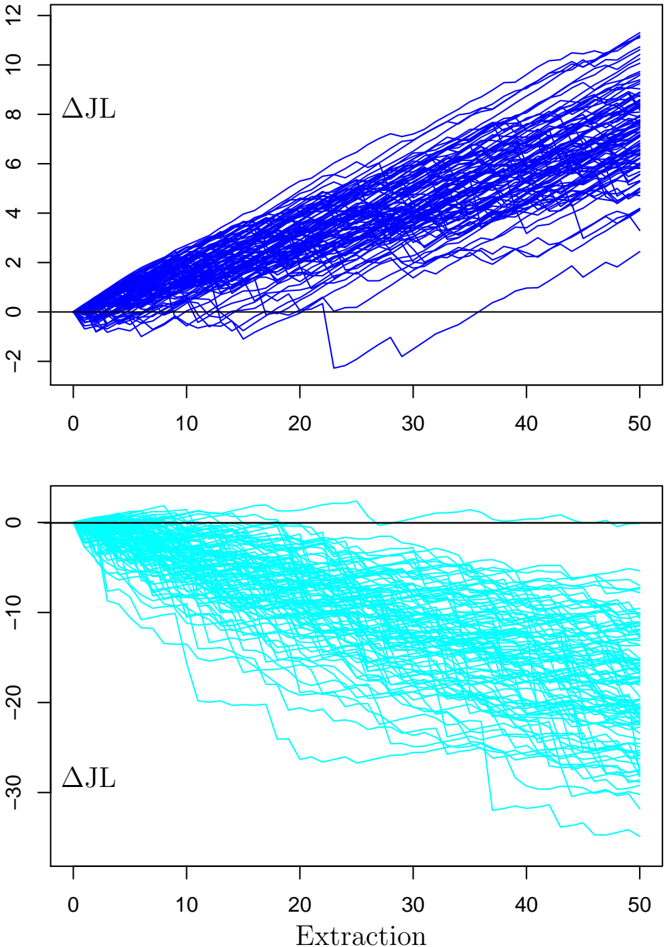
The image presents two line charts stacked vertically. Both charts depict the relationship between "Extraction" on the x-axis and "ΔJL" on the y-axis. Each chart contains numerous lines, representing different data series. The top chart shows positive ΔJL values, while the bottom chart shows negative ΔJL values.
### Components/Axes
* **X-axis Label (Both Charts):** "Extraction" - ranging from approximately 0 to 50.
* **Y-axis Label (Both Charts):** "ΔJL" - Top chart ranges from approximately -2 to 12. Bottom chart ranges from approximately -30 to 0.
* **Data Series:** Numerous lines are plotted on each chart, each representing a unique data series. There is no explicit legend, so individual lines cannot be identified.
* **Chart Arrangement:** Two charts are stacked vertically, with the top chart displaying positive ΔJL values and the bottom chart displaying negative ΔJL values.
### Detailed Analysis or Content Details
**Top Chart (Positive ΔJL):**
* **Trend:** Most lines exhibit an upward trend, indicating that ΔJL generally increases with increasing Extraction. However, there is significant variation in the slope and intercept of each line.
* **Data Points (Approximate):**
* At Extraction = 0, ΔJL ranges from approximately -1 to 3.
* At Extraction = 50, ΔJL ranges from approximately 4 to 11.
* One line shows a sharp drop in ΔJL around Extraction = 20, falling to approximately -2 before recovering slightly.
* The majority of lines are clustered between ΔJL = 2 and ΔJL = 8 for Extraction values between 10 and 40.
**Bottom Chart (Negative ΔJL):**
* **Trend:** Most lines exhibit a downward trend, indicating that ΔJL generally decreases with increasing Extraction. Similar to the top chart, there is significant variation in the slope and intercept of each line.
* **Data Points (Approximate):**
* At Extraction = 0, ΔJL ranges from approximately -2 to -28.
* At Extraction = 50, ΔJL ranges from approximately -10 to -32.
* Several lines show a relatively stable ΔJL value for Extraction values between 0 and 20, before a more rapid decline.
* The majority of lines are clustered between ΔJL = -5 and ΔJL = -20 for Extraction values between 10 and 40.
### Key Observations
* The separation of positive and negative ΔJL values into two separate charts suggests a bifurcation or threshold in the data.
* The significant variation in the lines within each chart indicates a high degree of variability in the relationship between Extraction and ΔJL.
* The upward trend in the top chart and the downward trend in the bottom chart suggest a potential correlation between Extraction and the sign of ΔJL.
* The outlier line in the top chart, with the sharp drop in ΔJL, warrants further investigation.
### Interpretation
The data suggests that ΔJL is sensitive to Extraction, with the relationship being highly variable. The bifurcation into positive and negative ΔJL values indicates that there may be a critical point or threshold in the Extraction process that determines the sign of ΔJL. The variability in the lines suggests that other factors, not explicitly represented in the chart, may also influence ΔJL. The outlier line in the top chart could represent an anomalous event or a different underlying mechanism.
The charts likely represent a simulation or experimental results where ΔJL is a measured quantity that changes as a function of the "Extraction" parameter. Without further context, it is difficult to determine the specific meaning of ΔJL and Extraction. However, the data suggests that controlling Extraction is important for managing ΔJL, and that understanding the factors contributing to the variability in ΔJL is crucial for accurate prediction and control. The separation of the charts into positive and negative ΔJL values could indicate a phase transition or a change in the underlying process.