## Line Graphs: ΔJL vs Extraction Trends
### Overview
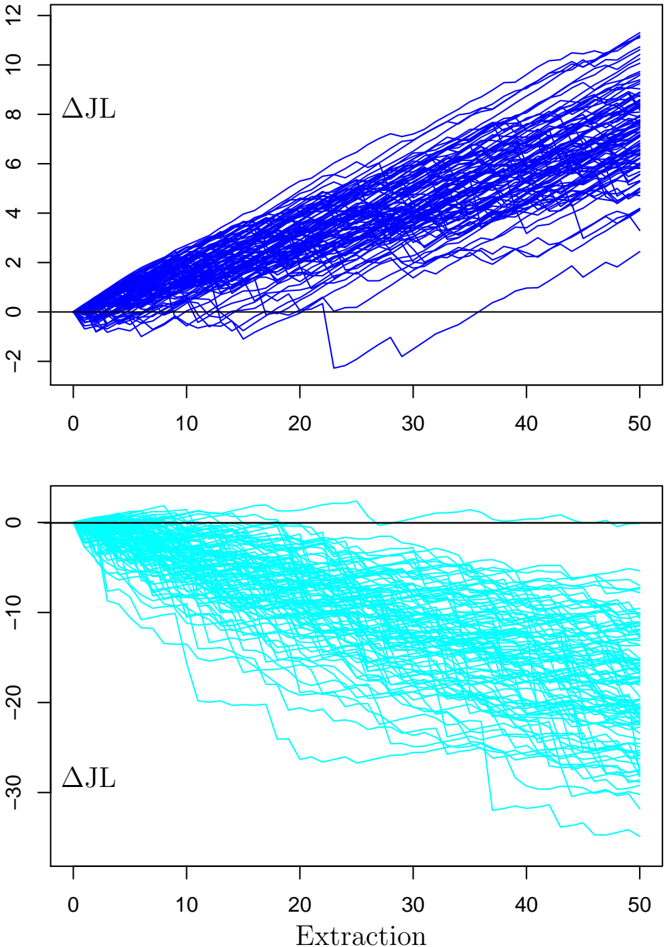
The image contains two vertically stacked line graphs. The top graph shows a blue dataset labeled ΔJL, while the bottom graph displays a cyan dataset also labeled ΔJL. Both graphs share an x-axis labeled "Extraction" (0–50) and a horizontal reference line at y=0. The y-axes differ: the top ranges from -2 to 12, and the bottom from -30 to 0.
### Components/Axes
- **Top Graph (Blue):**
- **Y-axis (ΔJL):** -2 to 12 (linear scale)
- **X-axis (Extraction):** 0 to 50 (linear scale)
- **Reference Line:** Horizontal at y=0 (black)
- **Lines:** Dense, overlapping blue lines with jagged, upward-sloping trends. Some lines exhibit sharp dips (e.g., near x=25).
- **Bottom Graph (Cyan):**
- **Y-axis (ΔJL):** -30 to 0 (linear scale)
- **X-axis (Extraction):** 0 to 50 (linear scale)
- **Reference Line:** Horizontal at y=0 (black)
- **Lines:** Dense, overlapping cyan lines with jagged, downward-sloping trends. Lines flatten near x=40.
### Detailed Analysis
- **Top Graph Trends:**
- Lines originate near y=0 at x=0 and ascend to ~12 by x=50.
- Variability: Lines show erratic fluctuations (e.g., peaks at x=10, troughs at x=20).
- Outlier: One line dips below y=0 near x=25 before recovering.
- **Bottom Graph Trends:**
- Lines start near y=0 at x=0 and descend to ~-30 by x=50.
- Variability: Lines exhibit sharp declines (e.g., steep drop at x=15) and plateaus (e.g., x=30–40).
- Consistency: All lines remain below y=0 after x=5.
### Key Observations
1. **Divergent Trends:** The top graph shows growth (ΔJL increasing with extraction), while the bottom graph shows decay (ΔJL decreasing with extraction).
2. **Reference Line Significance:** The y=0 line acts as a threshold, separating positive (top) and negative (bottom) ΔJL values.
3. **Data Density:** Both graphs have tightly packed lines, suggesting repeated measurements or high variability.
4. **Asymmetry:** The top graph’s range (+14 units) is narrower than the bottom graph’s range (-30 units).
### Interpretation
- **ΔJL Dynamics:** The data likely represents a system where extraction influences ΔJL differently in two regimes. The top graph may reflect a "gain" phase (e.g., resource accumulation), while the bottom graph shows a "loss" phase (e.g., depletion).
- **Threshold Behavior:** The y=0 line could represent a critical transition point (e.g., system stability boundary). The top graph’s lines crossing y=0 near x=25 suggest temporary reversals in the trend.
- **Practical Implications:** If ΔJL represents a measurable quantity (e.g., energy, material), the graphs imply extraction drives opposing outcomes in different contexts. The bottom graph’s steeper decline may indicate a tipping point or resource exhaustion.
### Spatial Grounding & Validation
- **Legend:** No explicit legend; colors (blue/cyan) are directly tied to graph positions.
- **Axis Consistency:** Both graphs share identical x-axis labels and scales, ensuring comparability.
- **Trend Verification:** Blue lines in the top graph unambiguously slope upward; cyan lines in the bottom graph slope downward. No conflicting data placements observed.