## Multi-Panel Line Chart: Network Evolution Metrics over Iterations
### Overview
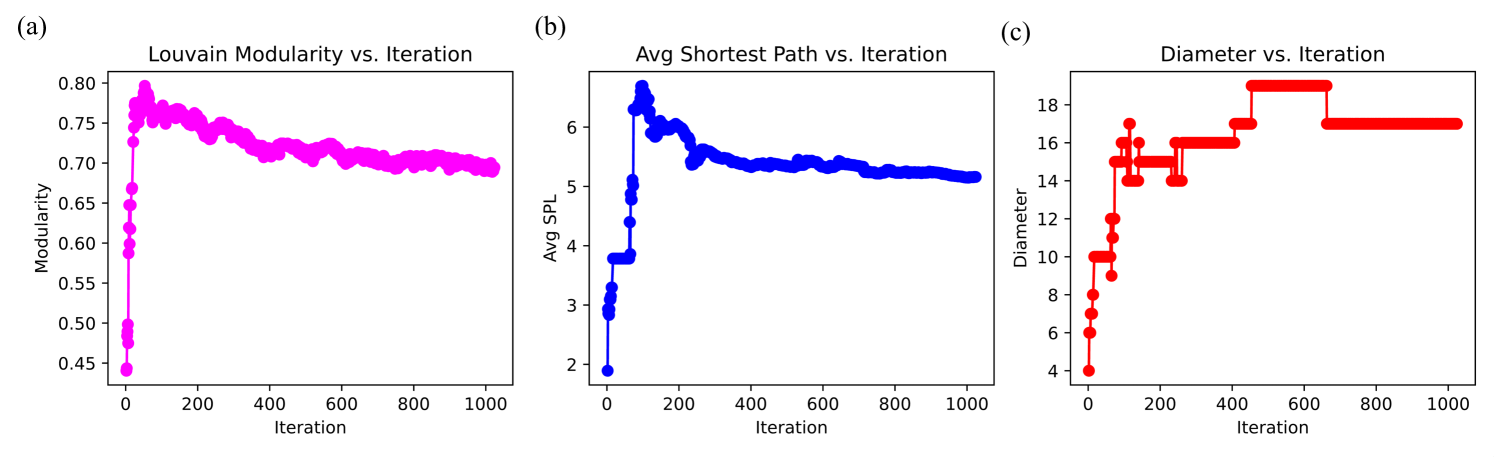
The image consists of three horizontally aligned line charts, labeled (a), (b), and (c) from left to right. All three charts share a common X-axis metric ("Iteration") ranging from 0 to over 1000, indicating they likely represent different metrics tracked simultaneously during a single computational process, simulation, or algorithm execution (such as a network growth model or a community detection algorithm). The language used throughout is English.
### Components/Axes
**Chart (a) - Left Panel**
* **Spatial Positioning:** Leftmost chart. Label "(a)" is in the top-left corner outside the plot area.
* **Title:** "Louvain Modularity vs. Iteration" (Top center).
* **X-axis:** Label "Iteration" (Bottom center). Markers at 0, 200, 400, 600, 800, 1000.
* **Y-axis:** Label "Modularity" (Left side, rotated 90 degrees). Markers at 0.45, 0.50, 0.55, 0.60, 0.65, 0.70, 0.75, 0.80.
* **Data Series:** A single line with circular markers, colored magenta.
**Chart (b) - Center Panel**
* **Spatial Positioning:** Center chart. Label "(b)" is in the top-left corner outside the plot area.
* **Title:** "Avg Shortest Path vs. Iteration" (Top center).
* **X-axis:** Label "Iteration" (Bottom center). Markers at 0, 200, 400, 600, 800, 1000.
* **Y-axis:** Label "Avg SPL" (Left side, rotated 90 degrees). Markers at 2, 3, 4, 5, 6.
* **Data Series:** A single line with circular markers, colored blue.
**Chart (c) - Right Panel**
* **Spatial Positioning:** Rightmost chart. Label "(c)" is in the top-left corner outside the plot area.
* **Title:** "Diameter vs. Iteration" (Top center).
* **X-axis:** Label "Iteration" (Bottom center). Markers at 0, 200, 400, 600, 800, 1000.
* **Y-axis:** Label "Diameter" (Left side, rotated 90 degrees). Markers at 4, 6, 8, 10, 12, 14, 16, 18.
* **Data Series:** A single line with circular markers, colored red.
### Detailed Analysis
**Chart (a): Louvain Modularity**
* **Visual Trend:** The magenta line exhibits a near-vertical spike immediately at the start, reaches a global maximum, and then enters a long, gradual, slightly oscillating decline, eventually stabilizing.
* **Data Points (Approximate):**
* Starts at Iteration 0 with a value of ~0.44.
* Shoots up rapidly, crossing 0.50, 0.60, and 0.70 within the first ~25 iterations.
* Peaks at ~0.80 around Iteration 50-60.
* Gradually declines to ~0.75 by Iteration 200.
* Continues a slow, wavy descent to ~0.71 by Iteration 400.
* Stabilizes around ~0.69 to ~0.70 from Iteration 800 through 1000+.
**Chart (b): Average Shortest Path Length (Avg SPL)**
* **Visual Trend:** The blue line shows a rapid, stepped increase initially, followed by a sharp spike to a peak, a quick drop, and then a long, smooth asymptotic decay.
* **Data Points (Approximate):**
* Starts at Iteration 0 with a value of ~1.9.
* Jumps rapidly to ~2.9, then ~3.8 within the first ~30 iterations.
* Plateaus briefly at ~3.8 until roughly Iteration 70.
* Spikes sharply to a peak of ~6.7 around Iteration 100.
* Drops quickly to ~5.9 by Iteration 150.
* Gradually decays to ~5.4 by Iteration 400.
* Levels off, ending at ~5.1 by Iteration 1000.
**Chart (c): Diameter**
* **Visual Trend:** The red line exhibits distinct step-function behavior, indicating discrete integer values. It steps up rapidly, fluctuates slightly, reaches a high plateau, and then steps down to a final, stable plateau.
* **Data Points (Approximate):**
* Starts at Iteration 0 with a value of 4.
* Steps up rapidly through 6, 8, and 10 within the first ~30 iterations.
* Jumps to 15, 16, and peaks briefly at 17 around Iteration 100.
* Drops back to 14 and 15 between Iterations 150-200.
* Holds a plateau at 16 from Iteration ~250 to ~400.
* Steps up to 17, then reaches its maximum plateau of 19 from Iteration ~450 to ~650.
* Steps down to 17 at Iteration ~650 and remains perfectly flat at 17 through Iteration 1000+.
### Key Observations
1. **Phase Transition:** All three charts show a distinct "burn-in" or rapid structural change phase between Iterations 0 and roughly 150. During this time, Modularity peaks, Avg SPL peaks, and Diameter expands rapidly.
2. **Convergence/Stabilization:** After Iteration 650, all three metrics have largely stabilized. Modularity is slowly decaying but mostly flat, Avg SPL has reached an asymptote, and Diameter is locked at a constant integer value.
3. **Discrete vs. Continuous:** Charts (a) and (b) represent continuous variables (averages and modularity scores), while Chart (c) represents a discrete variable (Diameter, which in graph theory is the maximum shortest path, inherently an integer in unweighted graphs). This is visually confirmed by the strict horizontal and vertical lines in the red series.
### Interpretation
These charts almost certainly depict the evolution of a network (graph) over time, likely during a generative process, a rewiring simulation, or an optimization algorithm.
* **Louvain Modularity** measures the strength of division of a network into modules (clusters/communities). The rapid spike to 0.80 suggests the algorithm quickly found or created highly distinct communities. The subsequent slow decline suggests that as the network continued to evolve (perhaps adding more edges), the boundaries between these communities became slightly blurred, settling at a still-strong modularity of ~0.70.
* **Avg SPL and Diameter** are measures of network distance. The initial rapid increase in both indicates the network is "stretching out"—perhaps transitioning from a dense, fully connected initial state to a sparser, more complex topology.
* The peak in Avg SPL (~6.7) aligns chronologically with the peak in Modularity. This implies that when the communities were most distinct (highest modularity), it took the longest average time to traverse the network, likely because there were very few edges connecting different communities.
* As the iterations progress past 200, the Avg SPL decreases while the Diameter remains high (and even increases to 19 before settling at 17). This suggests the network is forming "shortcuts" or hubs that reduce the *average* distance between most nodes, even though the absolute *longest* distance between the two furthest nodes remains quite large.
* The stabilization of all metrics after iteration 800 indicates the algorithm has reached a steady state or convergence, where further iterations do not significantly alter the macro-topology of the network.