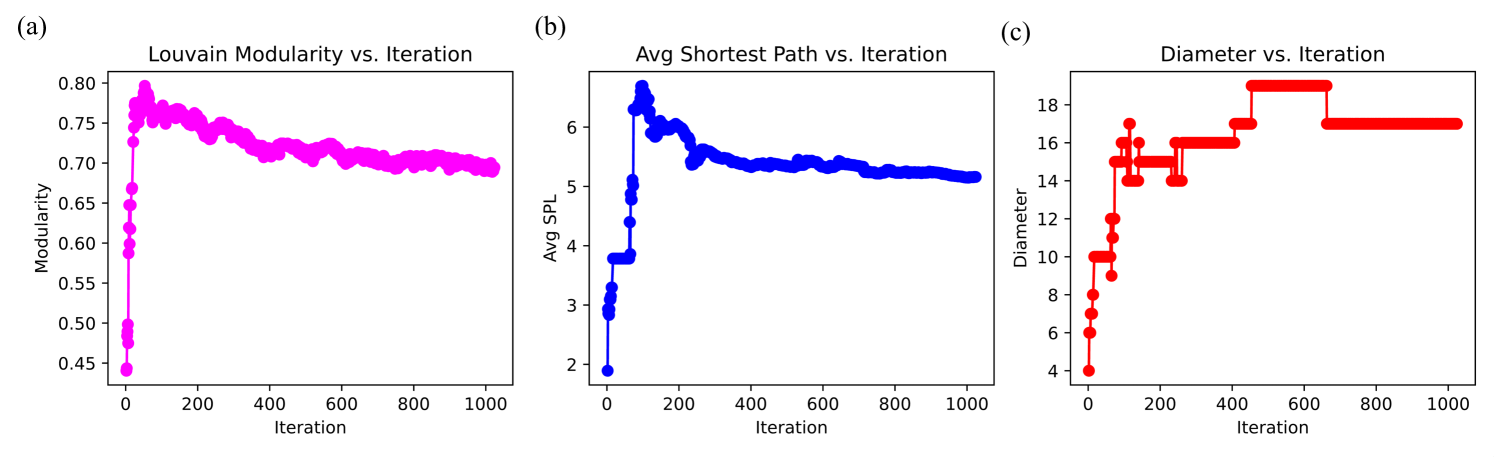
## Chart: Louvain Modularity, Avg Shortest Path, and Diameter vs. Iteration
### Overview
The image presents three line charts comparing the Louvain Modularity, Average Shortest Path (Avg SPL), and Diameter against the number of iterations. Each chart displays how these metrics change over 1000 iterations.
### Components/Axes
* **Chart (a): Louvain Modularity vs. Iteration**
* X-axis: Iteration, ranging from 0 to 1000.
* Y-axis: Modularity, ranging from 0.45 to 0.80.
* Data Series: Magenta line representing Louvain Modularity.
* **Chart (b): Avg Shortest Path vs. Iteration**
* X-axis: Iteration, ranging from 0 to 1000.
* Y-axis: Avg SPL, ranging from 2 to 6.
* Data Series: Blue line representing Average Shortest Path.
* **Chart (c): Diameter vs. Iteration**
* X-axis: Iteration, ranging from 0 to 1000.
* Y-axis: Diameter, ranging from 4 to 18.
* Data Series: Red line representing Diameter.
### Detailed Analysis
* **Chart (a): Louvain Modularity vs. Iteration**
* Trend: The magenta line starts at approximately 0.45, rapidly increases to around 0.77 within the first 100 iterations, and then gradually decreases and stabilizes around 0.71 for the remaining iterations.
* Data Points:
* Iteration 0: Modularity ~0.45
* Iteration 100: Modularity ~0.77
* Iteration 1000: Modularity ~0.71
* **Chart (b): Avg Shortest Path vs. Iteration**
* Trend: The blue line starts at approximately 2, rapidly increases to around 6.2 within the first 100 iterations, and then gradually decreases and stabilizes around 5.2 for the remaining iterations.
* Data Points:
* Iteration 0: Avg SPL ~2
* Iteration 100: Avg SPL ~6.2
* Iteration 1000: Avg SPL ~5.2
* **Chart (c): Diameter vs. Iteration**
* Trend: The red line starts at approximately 4, increases stepwise to around 17 by iteration 400, and then remains relatively stable around 17 for the remaining iterations.
* Data Points:
* Iteration 0: Diameter ~4
* Iteration 400: Diameter ~17
* Iteration 1000: Diameter ~17
### Key Observations
* Louvain Modularity initially increases sharply and then stabilizes with a slight decrease.
* Average Shortest Path also increases sharply initially and then stabilizes with a slight decrease.
* Diameter increases in discrete steps and then stabilizes.
### Interpretation
The charts illustrate the convergence behavior of a network analysis algorithm over iterations. The Louvain Modularity and Average Shortest Path metrics show an initial rapid change, indicating the algorithm is quickly optimizing the network structure. The subsequent stabilization suggests the algorithm has reached a point of diminishing returns. The Diameter, representing the longest shortest path between any two nodes in the network, increases in steps, likely reflecting significant structural changes at specific iterations before plateauing. The data suggests that the algorithm finds a relatively stable network configuration after a certain number of iterations, with only minor adjustments occurring thereafter.