## Line Charts: Network Metric Evolution over Iterations
### Overview
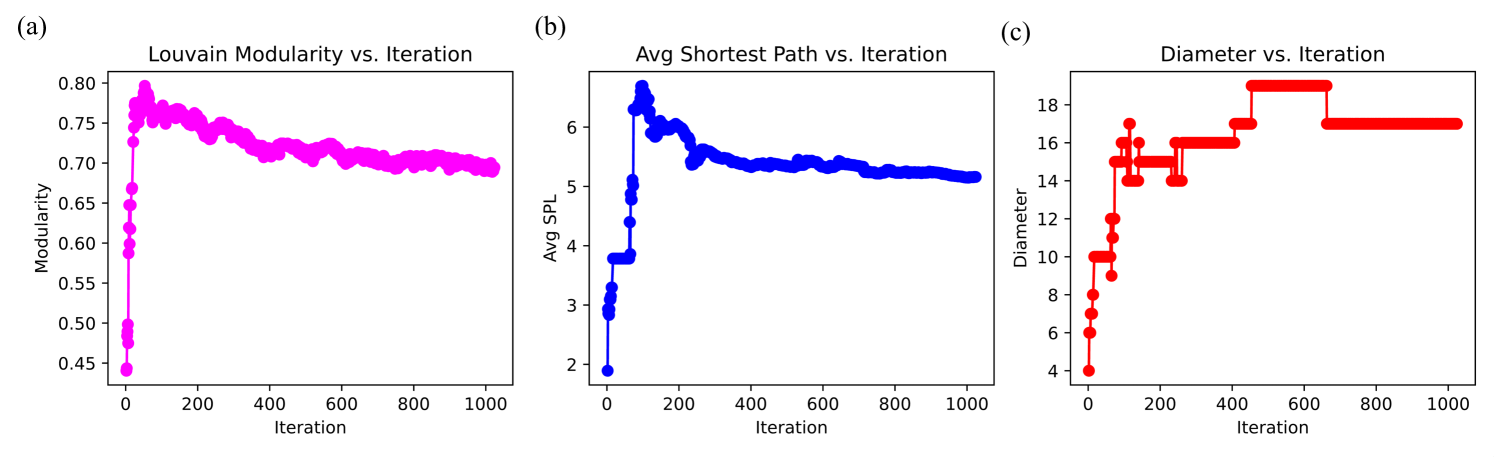
The image presents three distinct line charts, labeled (a), (b), and (c), arranged horizontally. These charts track the evolution of three specific network metrics—Louvain Modularity, Average Shortest Path (Avg SPL), and Diameter—as a function of iteration count (ranging from 0 to 1000).
### Components/Axes
All three charts share a common x-axis labeled "Iteration," spanning from 0 to 1000.
* **Chart (a) - Left:**
* **Title:** "Louvain Modularity vs. Iteration"
* **Y-Axis:** "Modularity," ranging from 0.45 to 0.80.
* **Data Series:** Magenta line with circular markers.
* **Chart (b) - Center:**
* **Title:** "Avg Shortest Path vs. Iteration"
* **Y-Axis:** "Avg SPL," ranging from 2 to 6.
* **Data Series:** Blue line with circular markers.
* **Chart (c) - Right:**
* **Title:** "Diameter vs. Iteration"
* **Y-Axis:** "Diameter," ranging from 4 to 18.
* **Data Series:** Red line with circular markers.
---
### Detailed Analysis
#### Chart (a): Louvain Modularity
* **Trend:** The line exhibits a sharp, near-vertical ascent from the start (iteration 0) to approximately iteration 50, reaching a peak. Following this peak, the trend is a gradual, slightly noisy decline that stabilizes between iterations 600 and 1000.
* **Data Points:**
* **Start:** Iteration 0, Modularity ~0.44.
* **Peak:** Iteration ~50, Modularity ~0.80.
* **End:** Iteration ~1000, Modularity ~0.70.
#### Chart (b): Avg Shortest Path (Avg SPL)
* **Trend:** The line shows a rapid, step-like increase from the start up to iteration 100. After reaching its peak, the line undergoes a period of fluctuation before settling into a slow, gradual decline, stabilizing around iteration 600.
* **Data Points:**
* **Start:** Iteration 0, Avg SPL ~1.9.
* **Peak:** Iteration ~100, Avg SPL ~6.5.
* **End:** Iteration ~1000, Avg SPL ~5.2.
#### Chart (c): Diameter
* **Trend:** The line displays a distinct step-wise growth pattern. It increases rapidly in the first 100 iterations, continues to climb in discrete steps until reaching a maximum around iteration 500, and then drops slightly to a stable plateau for the remainder of the iterations.
* **Data Points:**
* **Start:** Iteration 0, Diameter = 4.
* **Intermediate Steps:** Notable plateaus at 10, 12, 15, and 16.
* **Peak:** Iteration ~500, Diameter = 19.
* **End:** Iteration ~1000, Diameter = 17.
---
### Key Observations
1. **High Volatility Phase:** All three metrics exhibit significant instability and rapid change within the first 100–200 iterations. This suggests a "burn-in" or rapid reorganization phase of the network.
2. **Stabilization:** By iteration 600, all three metrics enter a relatively stable state, suggesting the network structure has reached a quasi-equilibrium.
3. **Inverse Relationship:** While Louvain Modularity peaks early and declines, the Diameter and Avg SPL peak and maintain higher values relative to their starting points. This indicates that as the network becomes more defined (higher modularity initially), it also becomes more "stretched" or elongated (higher diameter/SPL).
### Interpretation
The data suggests a process of network formation or community detection optimization.
* **Initial Phase (0-100 iterations):** The algorithm or process is rapidly identifying community structures, as evidenced by the sharp spike in Louvain Modularity. Simultaneously, the network is expanding or becoming less dense, as indicated by the sharp rise in Diameter and Avg Shortest Path.
* **Refinement Phase (100-600 iterations):** The network structure is being refined. The slight decline in Modularity suggests that as the network structure is optimized, some community boundaries may be adjusted, slightly reducing the overall modularity score.
* **Equilibrium (600-1000 iterations):** The system reaches a steady state. The network maintains a stable community structure (Modularity ~0.70) and a stable global topology (Diameter ~17, Avg SPL ~5.2).
This pattern is characteristic of iterative graph algorithms where the network is being grown or rewired to optimize for community structure, often resulting in a trade-off between modularity and the global "reachability" (diameter) of the network.