## Charts: Network Community Detection Metrics vs. Iteration
### Overview
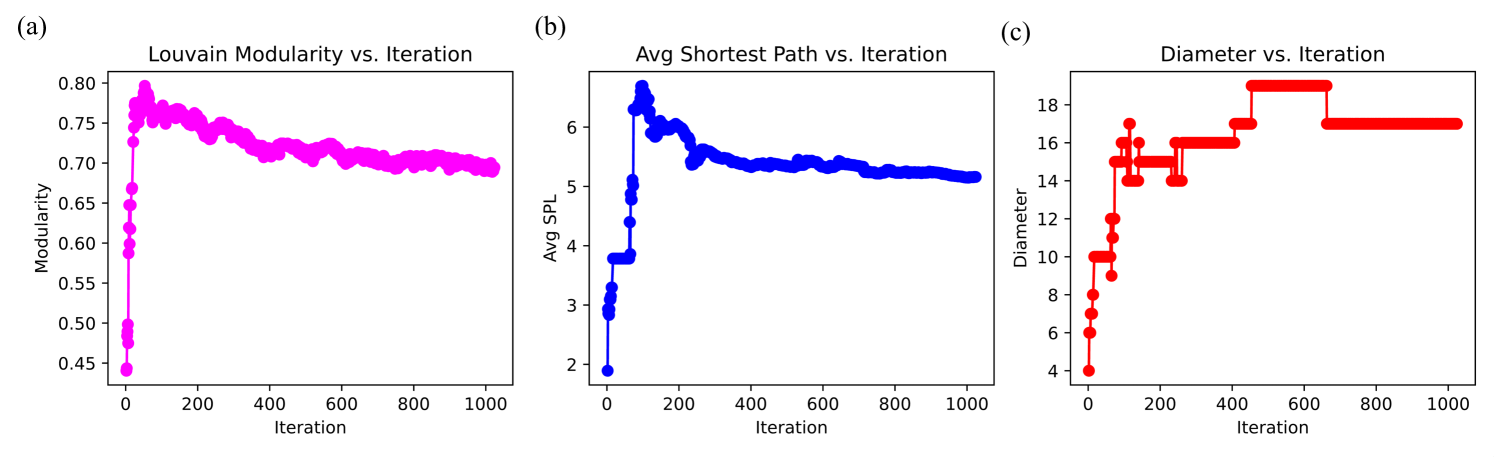
The image presents three separate line charts (labeled a, b, and c) illustrating the evolution of network community detection metrics – Louvain Modularity, Average Shortest Path Length (Avg SPL), and Diameter – as a function of iteration number. All charts share a common x-axis representing "Iteration" ranging from 0 to 1000. Each chart visualizes the change in its respective metric during the iterative community detection process.
### Components/Axes
* **Chart a: Louvain Modularity vs. Iteration**
* X-axis: Iteration (0 to 1000)
* Y-axis: Modularity (0.60 to 0.80)
* Line Color: Magenta (#FF00FF)
* **Chart b: Avg Shortest Path vs. Iteration**
* X-axis: Iteration (0 to 1000)
* Y-axis: Avg SPL (2.0 to 6.5)
* Line Color: Dark Blue (#00008B)
* **Chart c: Diameter vs. Iteration**
* X-axis: Iteration (0 to 1000)
* Y-axis: Diameter (4.0 to 18.0)
* Line Color: Red (#FF0000)
* Error Bars: Represented by vertical lines extending above and below the red line.
### Detailed Analysis
**Chart a: Louvain Modularity vs. Iteration**
The magenta line representing Louvain Modularity initially decreases sharply from approximately 0.74 at Iteration 0 to around 0.67 by Iteration 100. It then exhibits a fluctuating, generally decreasing trend, stabilizing around 0.66-0.68 between Iterations 500 and 1000. Approximate data points:
* Iteration 0: Modularity ≈ 0.74
* Iteration 100: Modularity ≈ 0.67
* Iteration 200: Modularity ≈ 0.66
* Iteration 500: Modularity ≈ 0.67
* Iteration 1000: Modularity ≈ 0.67
**Chart b: Avg Shortest Path vs. Iteration**
The dark blue line representing Average Shortest Path Length demonstrates a significant decrease from approximately 6.2 at Iteration 0 to around 4.8 by Iteration 200. The line then plateaus, with minor fluctuations, stabilizing around 4.7-5.0 between Iterations 400 and 1000. Approximate data points:
* Iteration 0: Avg SPL ≈ 6.2
* Iteration 100: Avg SPL ≈ 5.5
* Iteration 200: Avg SPL ≈ 4.8
* Iteration 500: Avg SPL ≈ 4.7
* Iteration 1000: Avg SPL ≈ 4.8
**Chart c: Diameter vs. Iteration**
The red line representing Diameter shows an initial decrease from approximately 17.0 at Iteration 0 to around 15.5 by Iteration 100. It then fluctuates with several plateaus and increases, reaching approximately 17.5 by Iteration 800, and then decreasing slightly to around 16.5 by Iteration 1000. The error bars indicate variability around the mean diameter at each iteration. Approximate data points:
* Iteration 0: Diameter ≈ 17.0 ± 1.0
* Iteration 100: Diameter ≈ 15.5 ± 0.5
* Iteration 200: Diameter ≈ 16.0 ± 0.5
* Iteration 500: Diameter ≈ 16.5 ± 0.5
* Iteration 800: Diameter ≈ 17.5 ± 0.5
* Iteration 1000: Diameter ≈ 16.5 ± 0.5
### Key Observations
* Modularity decreases over iterations, suggesting the network is becoming less modularly structured.
* Average Shortest Path Length decreases rapidly initially and then stabilizes, indicating the network is becoming more connected.
* Diameter initially decreases, then fluctuates, suggesting a complex relationship between network size and connectivity.
* The error bars in the Diameter chart indicate a relatively stable diameter with some variation.
### Interpretation
These charts likely represent the results of applying the Louvain algorithm for community detection to a network. The decreasing modularity suggests that the algorithm is finding communities that are less well-defined as the iterations progress. The decreasing average shortest path length indicates that the network is becoming more integrated, meaning that nodes are, on average, closer to each other. The fluctuating diameter suggests that the network's overall size and connectivity are changing in a non-monotonic way.
The initial rapid decrease in both Avg SPL and Diameter, coupled with the decrease in Modularity, suggests an initial phase of significant network restructuring. The subsequent stabilization of Avg SPL and the fluctuating Diameter indicate that the network is reaching a state of equilibrium where further iterations do not drastically alter its overall connectivity or size. The error bars on the Diameter plot suggest that the network's diameter is relatively stable, despite the fluctuations.
The combination of these metrics provides insights into the network's evolving structure during the community detection process. The algorithm appears to be initially breaking down existing communities to create a more connected network, but this process eventually stabilizes, resulting in a network with a relatively constant average shortest path length and diameter.