\n
## Line Charts: Network Metric Evolution Over Iterations
### Overview
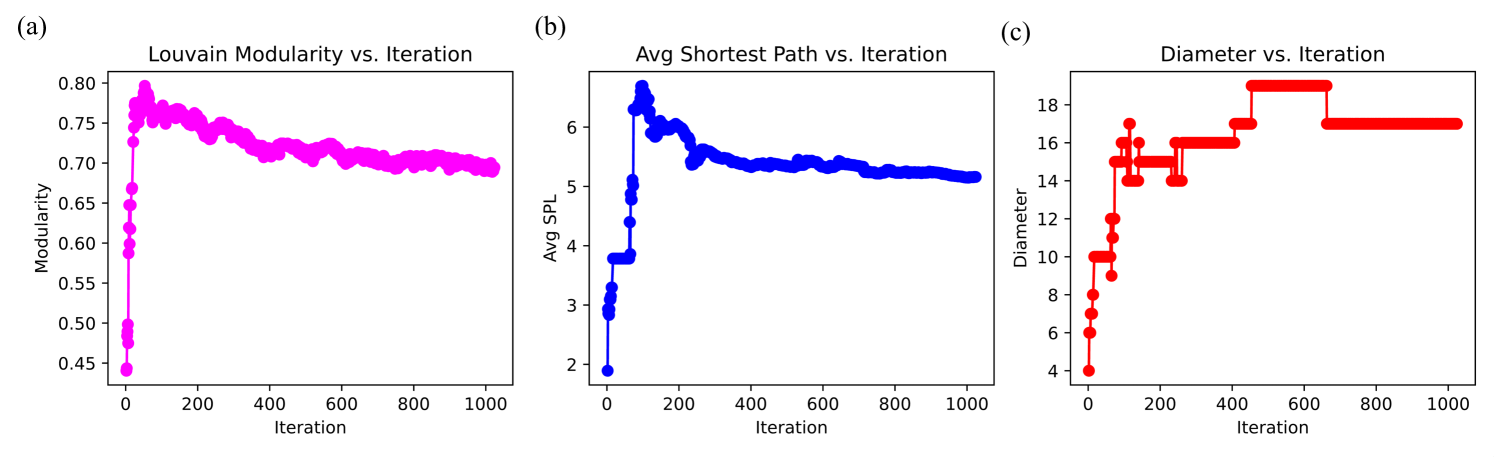
The image contains three horizontally arranged line charts, labeled (a), (b), and (c), each plotting a different network metric against the number of iterations of an algorithm (likely a community detection or network optimization algorithm). The charts share a common x-axis ("Iteration") ranging from 0 to 1000. Each chart uses a distinct color for its data series and markers.
### Components/Axes
* **Common X-Axis (All Charts):**
* **Label:** "Iteration"
* **Scale:** Linear, from 0 to 1000.
* **Major Tick Marks:** 0, 200, 400, 600, 800, 1000.
* **Chart (a) - Left:**
* **Title:** "Louvain Modularity vs. Iteration"
* **Y-Axis Label:** "Modularity"
* **Y-Axis Scale:** Linear, from 0.45 to 0.80.
* **Data Series Color:** Magenta (bright pink).
* **Marker Style:** Solid circles.
* **Chart (b) - Center:**
* **Title:** "Avg Shortest Path vs. Iteration"
* **Y-Axis Label:** "Avg SPL" (presumably Average Shortest Path Length).
* **Y-Axis Scale:** Linear, from 2 to 6.
* **Data Series Color:** Blue.
* **Marker Style:** Solid circles.
* **Chart (c) - Right:**
* **Title:** "Diameter vs. Iteration"
* **Y-Axis Label:** "Diameter"
* **Y-Axis Scale:** Linear, from 4 to 18.
* **Data Series Color:** Red.
* **Marker Style:** Solid circles.
### Detailed Analysis
**Chart (a): Louvain Modularity**
* **Trend Verification:** The magenta line shows a very sharp, near-vertical increase from a low starting point, peaks early, and then exhibits a gradual, noisy decline over the remaining iterations.
* **Data Points (Approximate):**
* Iteration 0: Modularity ≈ 0.44.
* Rapid increase to a peak: Modularity ≈ 0.80 at approximately iteration 50.
* Following the peak, the value fluctuates but trends downward.
* By iteration 200: Modularity ≈ 0.75.
* By iteration 400: Modularity ≈ 0.72.
* By iteration 600: Modularity ≈ 0.71.
* By iteration 1000: Modularity ≈ 0.70.
**Chart (b): Average Shortest Path Length (Avg SPL)**
* **Trend Verification:** The blue line shows a sharp initial increase, a peak, a subsequent decline, and then stabilizes into a plateau with minor fluctuations.
* **Data Points (Approximate):**
* Iteration 0: Avg SPL ≈ 1.8.
* Rapid increase to a peak: Avg SPL ≈ 6.5 at approximately iteration 100.
* Decline after the peak.
* By iteration 200: Avg SPL ≈ 5.8.
* By iteration 400: Avg SPL ≈ 5.4.
* From iteration 600 to 1000: The value stabilizes around Avg SPL ≈ 5.2, with very slight downward drift.
**Chart (c): Diameter**
* **Trend Verification:** The red line shows a stepwise increasing trend. It rises sharply in discrete jumps, plateaus, and then jumps again, reaching a final plateau.
* **Data Points (Approximate):**
* Iteration 0: Diameter = 4.
* Sharp, step-like increases occur in the first ~150 iterations.
* Plateaus are visible at Diameter ≈ 10, 14, 15, and 16.
* A final jump occurs around iteration 450-500.
* From approximately iteration 500 to 1000: The diameter stabilizes at a constant value of 17.
### Key Observations
1. **Phase of Rapid Change:** All three metrics undergo their most significant changes within the first 200 iterations, suggesting an initial, volatile phase of the algorithm.
2. **Divergent Long-Term Trends:** After the initial phase, the metrics diverge. Modularity slowly decreases, Avg SPL stabilizes, and Diameter remains constant at its maximum value.
3. **Stepwise vs. Continuous Change:** The Diameter (c) changes in clear, discrete steps, while Modularity (a) and Avg SPL (b) change more continuously, albeit with noise.
4. **Peak and Decline:** Both Modularity and Avg SPL exhibit a distinct peak early in the process before settling to a lower, stable value.
### Interpretation
The data illustrates the evolution of a network's structural properties during an iterative optimization process, likely the Louvain method for community detection.
* **Initial Optimization (Iterations 0-~200):** The algorithm rapidly reorganizes the network. Modularity skyrockets, indicating the swift formation of well-defined communities. Concurrently, both the average shortest path length and the network diameter increase sharply. This suggests that as communities form, paths between nodes within the same community shorten, but paths between nodes in different communities may become longer, increasing the overall "spread" of the network.
* **Stabilization Phase (Iterations ~200-1000):** The algorithm enters a refinement phase. Modularity slowly decreases, which could indicate a slight merging or redefinition of communities that sacrifices some modularity for other properties. The average shortest path length stabilizes, suggesting the overall efficiency of information flow across the network has reached an equilibrium. The diameter remains fixed at its peak value (17), meaning the longest shortest path in the network no longer changes; the network's overall "size" is locked in.
* **Trade-off Revealed:** The plots collectively demonstrate a potential trade-off. Achieving high modularity (strong community structure) early on comes at the cost of increasing the network's diameter and average path length. The final state is a network with a stable, slightly lower modularity, a fixed maximum diameter, and a stable average path length. This could represent a balance between having distinct communities and maintaining reasonable global connectivity. The stepwise increase in diameter is particularly notable, suggesting that specific, discrete rewiring events during the optimization cause sudden jumps in the network's longest path.