## Line Charts: Network Metrics vs. Iteration
### Overview
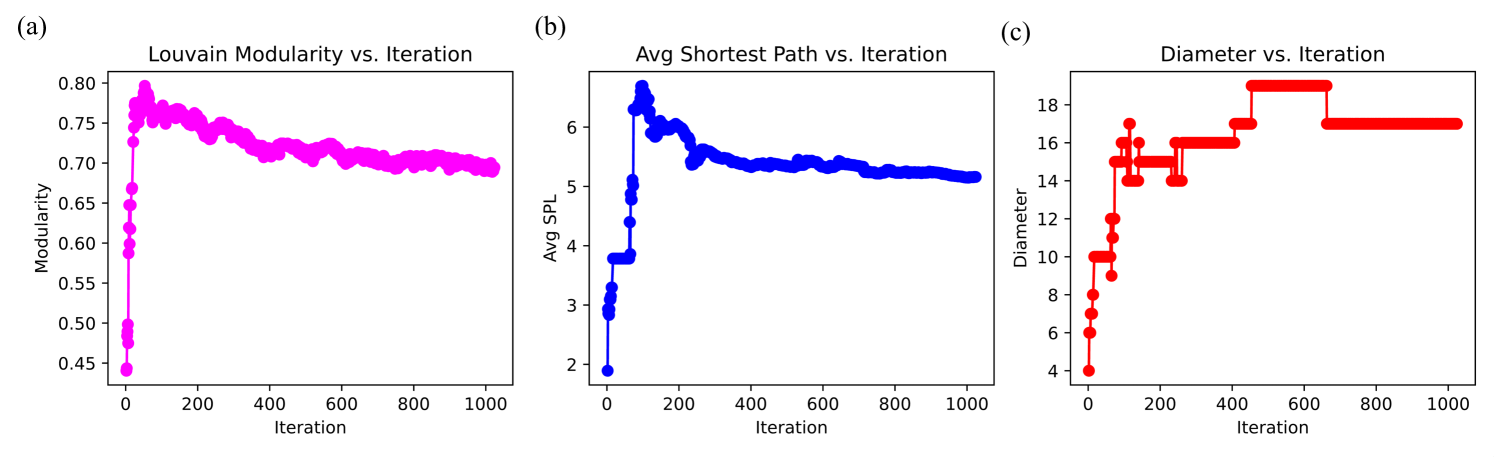
The image contains three line charts (a, b, c) depicting the evolution of network metrics (Louvain Modularity, Average Shortest Path Length, and Diameter) across 1,000 iterations. Each chart shows distinct trends, with stabilization observed after initial iterations.
### Components/Axes
- **Subplot (a)**:
- **Title**: "Louvain Modularity vs. Iteration"
- **Y-axis**: "Modularity" (range: 0.45–0.8)
- **X-axis**: "Iteration" (0–1,000)
- **Data**: Magenta line with markers.
- **Subplot (b)**:
- **Title**: "Avg Shortest Path vs. Iteration"
- **Y-axis**: "Avg SPL" (range: 2–6)
- **X-axis**: "Iteration" (0–1,000)
- **Data**: Blue line with markers.
- **Subplot (c)**:
- **Title**: "Diameter vs. Iteration"
- **Y-axis**: "Diameter" (range: 4–18)
- **X-axis**: "Iteration" (0–1,000)
- **Data**: Red line with markers.
### Detailed Analysis
#### Subplot (a): Louvain Modularity
- **Trend**: Modularity drops sharply from ~0.8 to ~0.7 within the first 100 iterations, then stabilizes with minor fluctuations (~0.68–0.72).
- **Key Data Points**:
- Iteration 0: ~0.8
- Iteration 100: ~0.72
- Iteration 1,000: ~0.70
#### Subplot (b): Average Shortest Path Length (SPL)
- **Trend**: SPL decreases rapidly from ~6 to ~5 within the first 200 iterations, then stabilizes (~5.0–5.2).
- **Key Data Points**:
- Iteration 0: ~6
- Iteration 200: ~5.2
- Iteration 1,000: ~5.1
#### Subplot (c): Diameter
- **Trend**: Diameter increases stepwise from 4 to 18 between iterations 0–600, then plateaus.
- **Key Data Points**:
- Iteration 0: 4
- Iteration 300: 14
- Iteration 600: 18
- Iteration 1,000: 18
### Key Observations
1. **Stabilization**: All metrics stabilize after ~200–600 iterations, suggesting convergence of network properties.
2. **Modularity vs. SPL Trade-off**: Modularity (community structure) and SPL (connectivity) both decrease, indicating a balance between community cohesion and network efficiency.
3. **Diameter Anomaly**: The stepwise increase in diameter (subplot c) suggests threshold-based changes in network topology (e.g., community mergers/splits).
### Interpretation
- **Louvain Algorithm Behavior**: The rapid drop in modularity (subplot a) reflects the algorithm’s initial community refinement, while stabilization implies optimal community detection.
- **Network Efficiency**: The decline in SPL (subplot b) indicates improved connectivity as communities form, reducing average path lengths.
- **Diameter Dynamics**: The abrupt rise in diameter (subplot c) may signal a phase where distant communities emerge, increasing the network’s overall spread before stabilizing.
**Note**: All values are approximate, derived from visual inspection of marker positions and axis scales. No explicit legend is present, but colors (magenta, blue, red) are uniquely assigned to each subplot.