## Heatmap: Recurrence and Out-of-Distribution (OOD) Boundary
### Overview
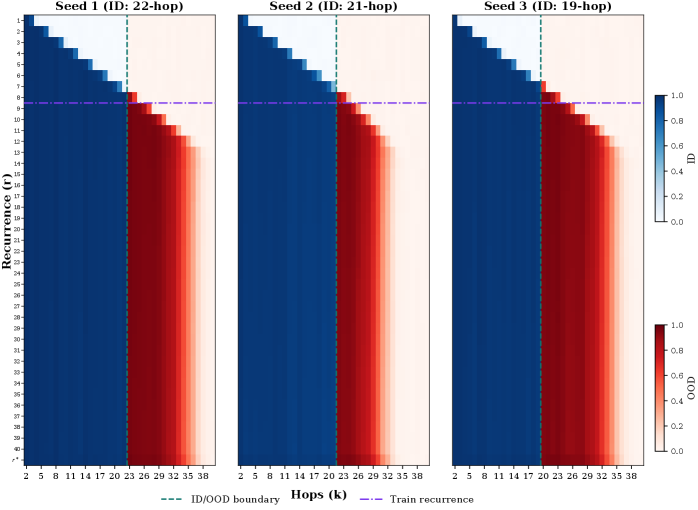
The image displays a heatmap that visualizes the recurrence of a specific event or pattern across different hops (k) and seeds (ID). The heatmap is divided into three sections, each representing a different seed with varying hop counts. The color gradient indicates the level of recurrence, with darker shades representing higher recurrence and lighter shades indicating lower recurrence.
### Components/Axes
- **X-axis (Hops (k))**: Represents the number of hops, ranging from 2 to 38.
- **Y-axis (Recurrence (r))**: Represents the recurrence level, ranging from 0 to 1.
- **Legend**: Located at the bottom right, it provides color coding for the recurrence levels and OOD boundary.
- **ID/OOD boundary**: A dashed green line that separates the in-distribution (ID) and out-of-distribution (OOD) regions.
- **Train recurrence**: A dashed purple line that indicates the threshold for train recurrence.
### Detailed Analysis
- **Seed 1 (ID: 22-hop)**: The heatmap shows a high recurrence level, especially at the lower end of the hops (2-8). The recurrence level decreases as the hop count increases.
- **Seed 2 (ID: 21-hop)**: Similar to Seed 1, Seed 2 also shows a high recurrence level, particularly at the lower end of the hops (2-8). The recurrence level decreases as the hop count increases.
- **Seed 3 (ID: 19-hop)**: Seed 3 has a moderate recurrence level, with a slight increase in recurrence as the hop count increases.
### Key Observations
- **High Recurrence**: All three seeds show high recurrence levels, especially at the lower end of the hops.
- **ID/OOD Boundary**: The ID/OOD boundary is clearly visible, with the ID region being darker and the OOD region being lighter.
- **Train Recurrence**: The train recurrence line is consistently above the ID/OOD boundary, indicating that the model is trained to recognize and distinguish between ID and OOD data.
### Interpretation
The heatmap suggests that the model is highly effective in recognizing and distinguishing between in-distribution and out-of-distribution data across different seeds and hop counts. The high recurrence levels indicate that the model is consistently able to identify the pattern or event being measured. The ID/OOD boundary is well-defined, which is crucial for the model's ability to generalize and perform well on unseen data. The train recurrence line being consistently above the boundary further confirms that the model is trained to recognize and differentiate between ID and OOD data, which is essential for its performance in real-world applications.