## Scatter Plots: Load vs. Work Index
### Overview
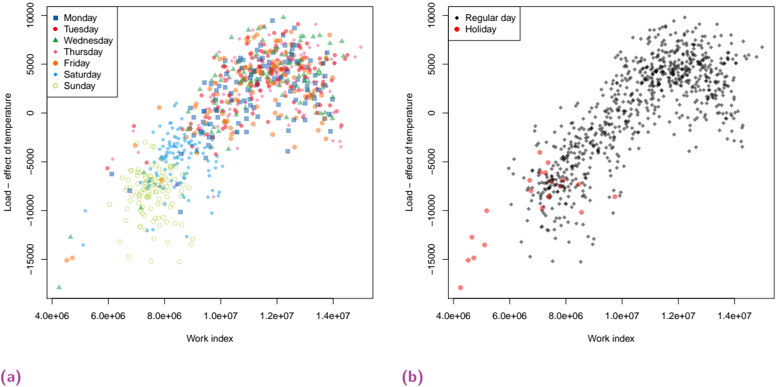
The image presents two scatter plots, (a) and (b), comparing "Load - effect of temperature" against "Work index". Plot (a) distinguishes data points by day of the week, while plot (b) differentiates between regular days and holidays. Both plots show a general upward trend, indicating a positive correlation between load and work index.
### Components/Axes
**Plot (a):**
* **X-axis:** "Work index", ranging from approximately 4.0e+06 to 1.4e+07, with markers at 4.0e+06, 6.0e+06, 8.0e+06, 1.0e+07, 1.2e+07, and 1.4e+07.
* **Y-axis:** "Load - effect of temperature", ranging from approximately -15000 to 10000, with markers at -15000, -10000, -5000, 0, 5000, and 10000.
* **Legend (top-left):**
* Blue Square: Monday
* Red Circle: Tuesday
* Green Triangle: Wednesday
* Pink Asterisk: Thursday
* Orange Plus: Friday
* Light Blue Dot: Saturday
* Light Green Open Circle: Sunday
**Plot (b):**
* **X-axis:** "Work index", ranging from approximately 4.0e+06 to 1.4e+07, with markers at 4.0e+06, 6.0e+06, 8.0e+06, 1.0e+07, 1.2e+07, and 1.4e+07.
* **Y-axis:** "Load - effect of temperature", ranging from approximately -15000 to 10000, with markers at -15000, -10000, -5000, 0, 5000, and 10000.
* **Legend (top-left):**
* Black Diamond: Regular day
* Red Circle: Holiday
### Detailed Analysis
**Plot (a):**
* **Monday (Blue Square):** The data points generally increase as the work index increases. Most points are between a work index of 8.0e+06 and 1.4e+07, and a load between 0 and 10000.
* **Tuesday (Red Circle):** Similar to Monday, the data points increase with the work index. Most points are between a work index of 8.0e+06 and 1.4e+07, and a load between 0 and 10000.
* **Wednesday (Green Triangle):** The data points also increase with the work index. Most points are between a work index of 8.0e+06 and 1.4e+07, and a load between 0 and 10000.
* **Thursday (Pink Asterisk):** The data points also increase with the work index. Most points are between a work index of 8.0e+06 and 1.4e+07, and a load between 0 and 10000.
* **Friday (Orange Plus):** The data points also increase with the work index. Most points are between a work index of 8.0e+06 and 1.4e+07, and a load between 0 and 10000.
* **Saturday (Light Blue Dot):** The data points also increase with the work index. Most points are between a work index of 6.0e+06 and 1.2e+07, and a load between -5000 and 5000.
* **Sunday (Light Green Open Circle):** The data points are concentrated at lower work index values, mostly between 6.0e+06 and 8.0e+06, and lower load values, mostly between -10000 and 0.
**Plot (b):**
* **Regular day (Black Diamond):** The data points generally increase as the work index increases. Most points are between a work index of 8.0e+06 and 1.4e+07, and a load between 0 and 10000.
* **Holiday (Red Circle):** The data points are concentrated at lower work index values, mostly between 4.0e+06 and 8.0e+06, and lower load values, mostly between -15000 and -5000.
### Key Observations
* Both plots show a positive correlation between "Load - effect of temperature" and "Work index".
* In plot (a), Sunday has a lower work index and load compared to other days of the week.
* In plot (b), holidays have a lower work index and load compared to regular days.
* The data points for Monday, Tuesday, Wednesday, Thursday, and Friday in plot (a) are clustered together, suggesting similar load patterns for these days.
### Interpretation
The data suggests that the "Load - effect of temperature" is influenced by both the "Work index" and the day of the week or whether it is a holiday. The positive correlation indicates that as the work index increases, the load also tends to increase. The lower load and work index values on Sundays and holidays suggest reduced activity or demand during these times. The clustering of data points for weekdays (Monday to Friday) indicates similar load patterns during these days. The plots provide insights into the relationship between load, work index, and temporal factors, which can be useful for load forecasting and resource management.