## Scatter Plot Comparison: Work Index vs. Load Effect of Temperature
### Overview
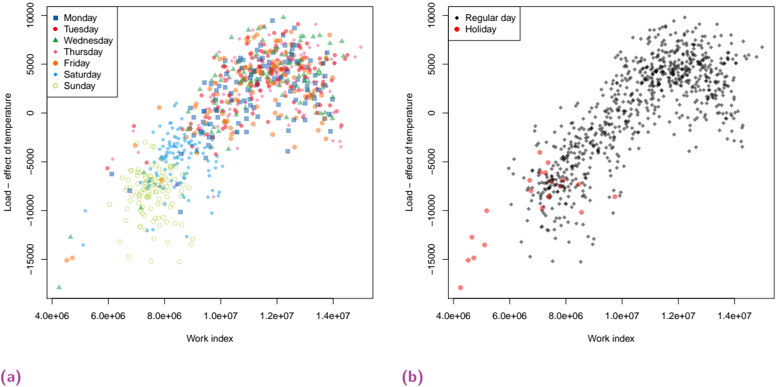
The image displays two side-by-side scatter plots, labeled (a) and (b), analyzing the relationship between "Work index" and "Load - effect of temperature." Both plots share identical axes and scales but categorize the same dataset differently. Plot (a) differentiates data points by the day of the week, while plot (b) categorizes them as either a "Regular day" or a "Holiday."
### Components/Axes
**Common to Both Plots:**
* **X-axis:** "Work index". Scale is linear, with major tick marks labeled in scientific notation: `4.0e+06`, `6.0e+06`, `8.0e+06`, `1.0e+07`, `1.2e+07`, `1.4e+07`. This corresponds to a range from 4,000,000 to 14,000,000.
* **Y-axis:** "Load - effect of temperature". Scale is linear, with major tick marks at `-15000`, `-10000`, `-5000`, `0`, `5000`, `10000`.
* **Plot Area:** A dense cloud of data points showing a positive correlation.
**Plot (a) - Left:**
* **Legend:** Located in the top-left corner. It maps days of the week to specific colors and marker shapes.
* Monday: Blue square (■)
* Tuesday: Red circle (●)
* Wednesday: Green triangle (▲)
* Thursday: Cyan plus sign (+)
* Friday: Orange diamond (◆)
* Saturday: Yellow asterisk (*)
* Sunday: Light green open circle (○)
**Plot (b) - Right:**
* **Legend:** Located in the top-left corner. It maps two categories to colors.
* Regular day: Black dot (•)
* Holiday: Red circle (●)
### Detailed Analysis
**Data Distribution & Trend:**
* **Trend Verification:** In both plots, the overall data cloud exhibits a clear **positive, roughly linear trend**. As the "Work index" increases, the "Load - effect of temperature" also tends to increase.
* **Spatial Grounding & Data Density:** The highest density of points is concentrated in the central region, approximately between Work index `8.0e+06` and `1.2e+07`, and Load effect `-5000` to `5000`. The cloud is less dense at the extremes.
* **Plot (a) - Day Analysis:** Data points for all days of the week are intermingled throughout the main cloud, suggesting the positive correlation holds across the entire week. No single day forms a distinct, separate cluster. There are a few outlier points with very low Load effect values (near `-15000`) at lower Work index values (`~4.0e+06` to `6.0e+06`); these appear to be from various days (e.g., a green triangle for Wednesday, a red circle for Tuesday).
* **Plot (b) - Holiday vs. Regular Day Analysis:**
* **Regular Days (Black dots):** Form the vast majority of the data and constitute the entire main cloud showing the positive trend.
* **Holidays (Red circles):** Are **not randomly distributed**. They are predominantly clustered in the **lower-left quadrant** of the plot. Most holiday points have a Work index below `8.0e+06` and a Load effect below `0`. A few holiday points are mixed into the lower end of the main cloud, but they are virtually absent from the upper-right region (high Work index, high Load effect).
### Key Observations
1. **Strong Positive Correlation:** There is a robust, positive relationship between the Work index and the Load effect of temperature.
2. **Holiday Distinction:** The most significant pattern is revealed in plot (b). Holidays are strongly associated with **lower Work index values** and **negative Load effect values**. They occupy a distinct region of the chart compared to regular days.
3. **Weekly Consistency:** Plot (a) shows no strong day-of-week effect; the relationship between the two variables appears consistent from Monday through Sunday.
4. **Outliers:** A small number of data points exist with extremely low Load effect values (approaching `-15000`) at low Work index values. These are present on both regular days and holidays.
### Interpretation
The data suggests that the "Work index" is a strong predictor of the "Load - effect of temperature," with higher work activity correlating with a greater temperature-related load effect.
The critical insight comes from the holiday analysis. The clustering of holidays at the low end of both scales indicates that on holidays, the measured "Work index" is substantially reduced, and the associated temperature load effect is often negative (potentially meaning cooling load or a reduction in heating load). This implies that the system or phenomenon being measured operates at a fundamentally different, lower-intensity state on holidays compared to regular days.
The absence of a day-of-week pattern in plot (a) reinforces that it is the *holiday status*, not the specific day, that drives this behavioral shift. The outliers at the extreme low end may represent special conditions, measurement errors, or non-working periods beyond standard holidays. For a technical document, this analysis highlights the importance of accounting for holiday schedules when modeling or forecasting this "Load - effect of temperature" based on the "Work index."