## Scatter Plots: Load vs. Work Index by Day Type
### Overview
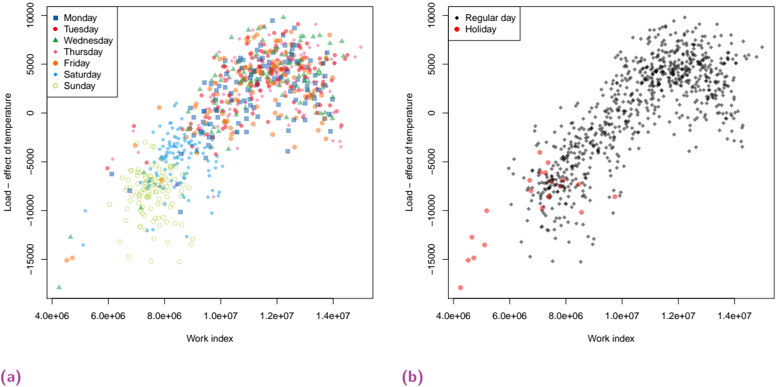
Two scatter plots compare the relationship between "Work index" (x-axis) and "Load – effect of temperature" (y-axis). Plot (a) categorizes data by weekday, while plot (b) distinguishes regular days from holidays. Both show a general positive correlation between work index and load effect, with distinct patterns for different day types.
---
### Components/Axes
#### Plot (a)
- **X-axis**: Work index (logarithmic scale, 4.0e+06 to 1.4e+07)
- **Y-axis**: Load – effect of temperature (linear scale, -15,000 to 10,000)
- **Legend**:
- **Colors/Markers**:
- Monday (blue squares), Tuesday (red circles), Wednesday (green triangles), Thursday (pink diamonds), Friday (orange stars), Saturday (yellow circles), Sunday (light green circles)
- Position: Top-left corner
#### Plot (b)
- **X-axis**: Work index (same scale as plot a)
- **Y-axis**: Load – effect of temperature (same scale as plot a)
- **Legend**:
- **Colors/Markers**:
- Regular day (black dots), Holiday (red dots)
- Position: Top-left corner
---
### Detailed Analysis
#### Plot (a)
- **Trends**:
- All days show a diagonal upward trend from lower-left to upper-right, indicating increasing load with higher work index.
- **Variability**:
- Saturday and Sunday data points are more dispersed (higher variance) compared to weekdays.
- Monday (blue) and Tuesday (red) clusters are tightly grouped near the lower end of the work index range.
- **Notable Outliers**:
- A single green triangle (Wednesday) at the extreme lower-left (work index ~4.0e+06, load ~-15,000).
#### Plot (b)
- **Trends**:
- Regular days (black) follow a consistent upward trend, mirroring plot (a).
- Holidays (red) are scattered but align with the same general direction, though with greater spread.
- **Notable Outliers**:
- A red holiday dot at the extreme lower-left (work index ~4.0e+06, load ~-15,000), matching the outlier in plot (a).
---
### Key Observations
1. **Positive Correlation**: Both plots confirm that higher work index values correspond to greater load effects.
2. **Day-Type Variability**:
- Weekends (Saturday/Sunday) in plot (a) exhibit higher load variability, suggesting non-linear or external factors.
- Holidays in plot (b) show similar trends to regular days but with wider dispersion, possibly indicating atypical conditions.
3. **Outlier Consistency**: The extreme lower-left outlier appears in both plots, likely representing a shared anomaly (e.g., system failure).
---
### Interpretation
- **Operational Insights**: The strong positive correlation implies that work index is a reliable predictor of load effects. However, weekends and holidays introduce variability, suggesting contextual factors (e.g., maintenance schedules, reduced staffing) may influence load independently of work index.
- **Anomaly Investigation**: The shared outlier warrants further scrutiny—it could represent a data entry error or an exceptional event (e.g., equipment malfunction) affecting both regular and holiday operations.
- **Design Implications**: Systems relying on work index for load prediction should account for day-type variability, particularly on weekends and holidays, to avoid underestimating demand.