## Line Chart: Accuracy of judging preferred and undesirable outputs
### Overview
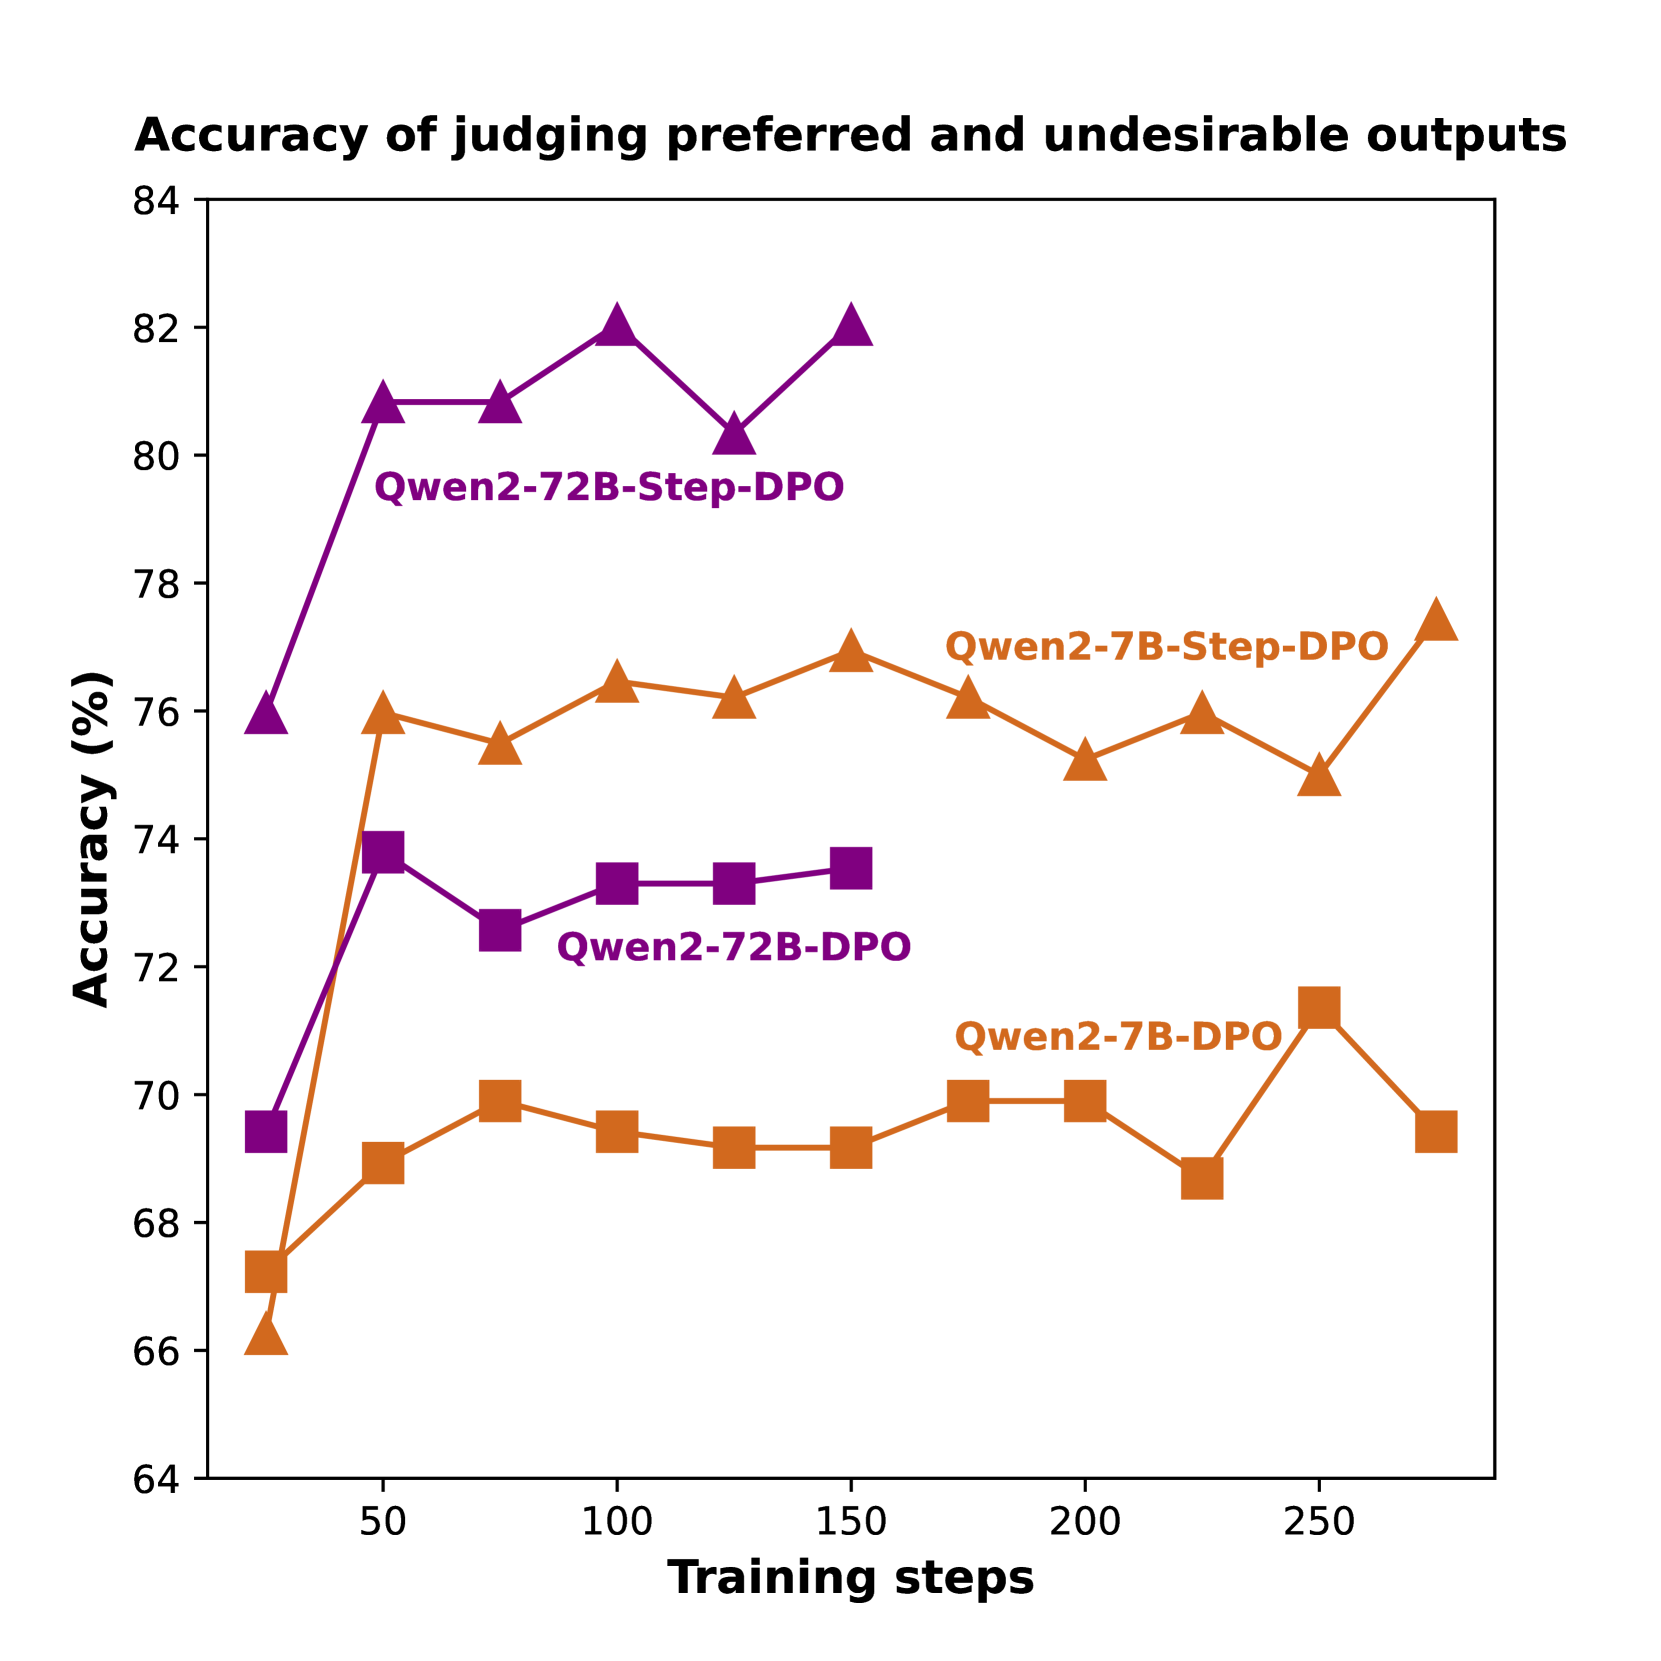
This line chart displays the accuracy of judging preferred and undesirable outputs for four different models (Qwen2-72B-Step-DPO, Qwen2-7B-Step-DPO, Qwen2-72B-DPO, and Qwen2-7B-DPO) over a range of training steps. The accuracy is measured in percentage (%) and plotted against the number of training steps.
### Components/Axes
* **Title:** Accuracy of judging preferred and undesirable outputs
* **X-axis:** Training steps (ranging from approximately 0 to 275)
* **Y-axis:** Accuracy (%) (ranging from approximately 64 to 84)
* **Data Series:**
* Qwen2-72B-Step-DPO (Purple line with triangle markers)
* Qwen2-7B-Step-DPO (Green line with circle markers)
* Qwen2-72B-DPO (Violet line with square markers)
* Qwen2-7B-DPO (Orange line with diamond markers)
### Detailed Analysis
Here's a breakdown of each data series, with approximate values extracted from the chart:
* **Qwen2-72B-Step-DPO (Purple):** This line generally slopes upward, indicating increasing accuracy with training steps.
* At 0 training steps: ~70% accuracy
* At 50 training steps: ~80% accuracy
* At 100 training steps: ~73% accuracy
* At 150 training steps: ~76% accuracy
* At 200 training steps: ~81% accuracy
* At 250 training steps: ~82% accuracy
* **Qwen2-7B-Step-DPO (Green):** This line shows a relatively stable accuracy with a slight upward trend.
* At 0 training steps: ~76% accuracy
* At 50 training steps: ~78% accuracy
* At 100 training steps: ~76% accuracy
* At 150 training steps: ~76% accuracy
* At 200 training steps: ~75% accuracy
* At 250 training steps: ~70% accuracy
* **Qwen2-72B-DPO (Violet):** This line exhibits a decreasing trend initially, followed by a slight increase.
* At 0 training steps: ~73% accuracy
* At 50 training steps: ~72% accuracy
* At 100 training steps: ~72% accuracy
* At 150 training steps: ~70% accuracy
* At 200 training steps: ~70% accuracy
* At 250 training steps: ~71% accuracy
* **Qwen2-7B-DPO (Orange):** This line shows a gradual increase in accuracy, with some fluctuations.
* At 0 training steps: ~67% accuracy
* At 50 training steps: ~69% accuracy
* At 100 training steps: ~70% accuracy
* At 150 training steps: ~70% accuracy
* At 200 training steps: ~70% accuracy
* At 250 training steps: ~69% accuracy
### Key Observations
* Qwen2-72B-Step-DPO consistently demonstrates the highest accuracy throughout the training process.
* Qwen2-7B-Step-DPO maintains a relatively high and stable accuracy.
* Qwen2-72B-DPO shows a slight decrease in accuracy initially, but stabilizes around 70-72%.
* Qwen2-7B-DPO starts with the lowest accuracy and shows a slow, gradual improvement.
* The accuracy of Qwen2-7B-Step-DPO decreases after 200 training steps.
### Interpretation
The chart suggests that the "Step-DPO" training method generally leads to higher accuracy in judging preferred and undesirable outputs, particularly for the larger Qwen2-72B model. The Qwen2-72B-Step-DPO model consistently outperforms the other models, indicating that increasing model size combined with the Step-DPO training technique is effective. The Qwen2-7B-Step-DPO model also performs well, suggesting that the Step-DPO method is beneficial even for smaller models. The Qwen2-72B-DPO model's initial dip in accuracy could be due to the learning process, where the model initially adjusts to the new training data before improving. The Qwen2-7B-DPO model's slower improvement suggests that it may require more training steps to reach optimal performance. The decrease in accuracy for Qwen2-7B-Step-DPO after 200 steps could indicate overfitting or the need for a different learning rate. Overall, the data highlights the importance of both model size and training methodology in achieving high accuracy in preference judgment tasks.