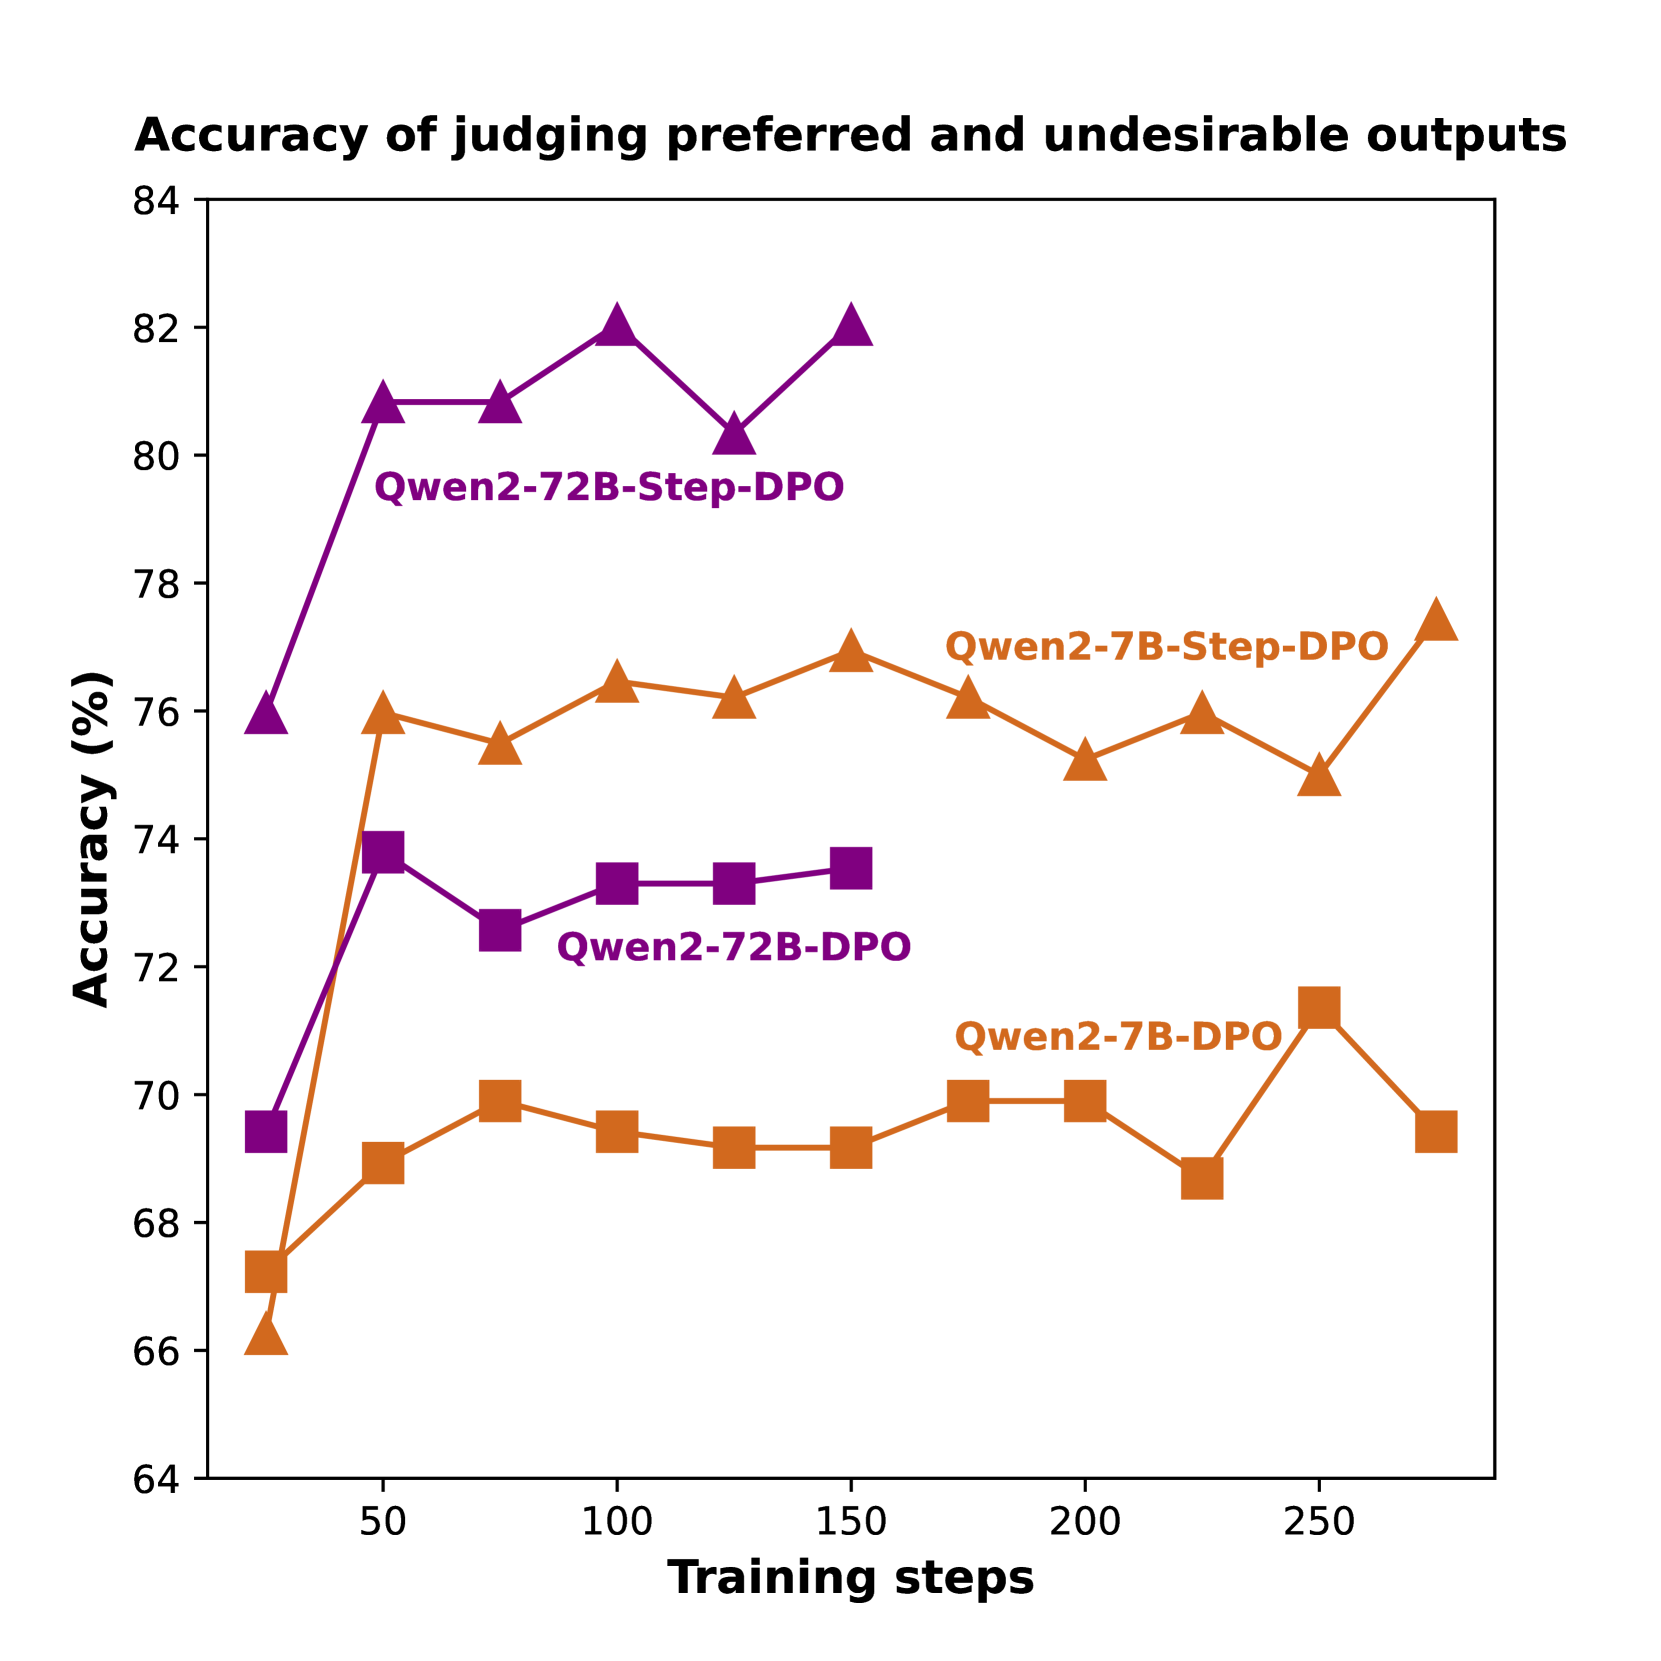
## Line Chart: Model Accuracy vs. Training Steps
### Overview
This line chart displays the performance of four different language model variants, based on the Qwen2 architecture, over the course of training. The performance metric is the accuracy (in percentage) of the model in judging preferred versus undesirable outputs. The chart compares two model sizes (7B and 72B parameters) and two training methodologies (DPO and Step-DPO).
### Components/Axes
* **Chart Title:** "Accuracy of judging preferred and undesirable outputs"
* **X-Axis:** Labeled "Training steps". The scale runs from 0 to 250, with major tick marks at intervals of 50 (50, 100, 150, 200, 250).
* **Y-Axis:** Labeled "Accuracy (%)". The scale runs from 64 to 84, with major tick marks at intervals of 2 (64, 66, 68, 70, 72, 74, 76, 78, 80, 82, 84).
* **Legend/Series:** The legend is embedded directly within the chart area, with labels placed near their corresponding lines. There are four distinct data series:
1. **Qwen2-72B-Step-DPO:** Represented by a **purple line with upward-pointing triangle markers**.
2. **Qwen2-7B-Step-DPO:** Represented by an **orange line with upward-pointing triangle markers**.
3. **Qwen2-72B-DPO:** Represented by a **purple line with square markers**.
4. **Qwen2-7B-DPO:** Represented by an **orange line with square markers**.
### Detailed Analysis
**Data Series and Approximate Trends:**
1. **Qwen2-72B-Step-DPO (Purple Triangles):**
* **Trend:** Shows a strong initial increase, followed by a high plateau with minor fluctuations. It is the top-performing series overall.
* **Approximate Data Points:**
* Step ~25: ~76%
* Step 50: ~81%
* Step 75: ~81%
* Step 100: ~82% (Peak)
* Step 125: ~80.5%
* Step 150: ~82%
2. **Qwen2-7B-Step-DPO (Orange Triangles):**
* **Trend:** Shows a sharp initial rise, then fluctuates within a band between approximately 75% and 77.5%. It is the second-highest performing series.
* **Approximate Data Points:**
* Step ~25: ~66.5%
* Step 50: ~76%
* Step 75: ~75.5%
* Step 100: ~76.5%
* Step 125: ~76.2%
* Step 150: ~77%
* Step 175: ~76.2%
* Step 200: ~75.2%
* Step 225: ~76%
* Step 250: ~75%
* Step ~275: ~77.5% (Final point, appears beyond the 250 tick)
3. **Qwen2-72B-DPO (Purple Squares):**
* **Trend:** Shows a moderate initial increase, then stabilizes in a narrow band around 73-74%. It performs below its Step-DPO counterpart.
* **Approximate Data Points:**
* Step ~25: ~69.5%
* Step 50: ~73.8%
* Step 75: ~72.8%
* Step 100: ~73.5%
* Step 125: ~73.5%
* Step 150: ~73.8%
4. **Qwen2-7B-DPO (Orange Squares):**
* **Trend:** Shows a gradual initial increase, then fluctuates between approximately 68.5% and 71.5%. It is the lowest-performing series overall.
* **Approximate Data Points:**
* Step ~25: ~67.5%
* Step 50: ~69%
* Step 75: ~70%
* Step 100: ~69.5%
* Step 125: ~69.2%
* Step 150: ~69.2%
* Step 175: ~70%
* Step 200: ~70%
* Step 225: ~68.8%
* Step 250: ~71.5% (Peak)
* Step ~275: ~69.5%
### Key Observations
1. **Methodology Superiority:** For both model sizes (7B and 72B), the **Step-DPO** variant (triangle markers) consistently achieves higher accuracy than the standard **DPO** variant (square markers) throughout the training steps shown.
2. **Model Size Advantage:** The larger **72B** models (purple lines) consistently outperform their smaller **7B** counterparts (orange lines) when using the same training methodology (Step-DPO or DPO).
3. **Performance Hierarchy:** The clear performance order from highest to lowest is: Qwen2-72B-Step-DPO > Qwen2-7B-Step-DPO > Qwen2-72B-DPO > Qwen2-7B-DPO.
4. **Convergence:** All models show a rapid improvement in the first 50 training steps, after which performance gains slow and enter a phase of fluctuation or plateau.
5. **Volatility:** The Qwen2-7B-Step-DPO series shows the most pronounced fluctuations in the later training steps (post step 150).
### Interpretation
The data strongly suggests that the **Step-DPO training methodology is more effective** than standard DPO for the task of judging output preference, as it yields higher accuracy across both model scales. This could indicate that the step-wise approach provides more stable or informative learning signals during alignment.
Furthermore, the consistent advantage of the **72B models over the 7B models** underscores the importance of model scale for this capability, even when using the same training technique. The larger model's capacity likely allows for a more nuanced understanding of the preference task.
From a Peircean investigative perspective, the chart presents a clear **abductive inference**: the observed performance gap between Step-DPO and DPO models (the sign) points to Step-DPO being a superior alignment technique for this specific metric (the interpretant). The **indexical** relationship is the direct link between training steps (cause) and accuracy improvement (effect). The **symbolic** representation is the chart itself, encoding the complex relationship between model size, training method, and performance into a visual form.
A notable anomaly is the final upward tick for Qwen2-7B-Step-DPO beyond step 250, which might suggest potential for further gains with extended training, whereas the 72B Step-DPO model appears to have fully plateaued. The dip in Qwen2-7B-Step-DPO around step 225 before its final rise could indicate a temporary instability in the optimization process for that model size.