## Chart: Max Logits vs. Training Steps
### Overview
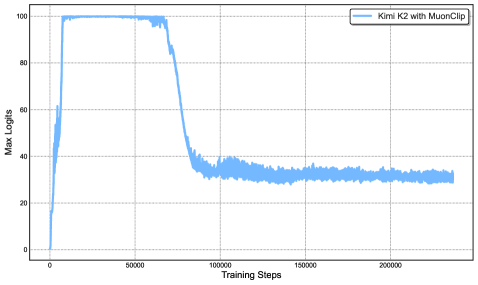
The image is a line chart showing the "Max Logits" on the y-axis versus "Training Steps" on the x-axis. The chart displays the performance of "Kimi K2 with MuonClip" during training. The line shows an initial rapid increase, followed by a plateau, then a decline, and finally a stabilization at a lower level.
### Components/Axes
* **Title:** There is no explicit title on the chart.
* **X-axis:** "Training Steps". The x-axis ranges from 0 to 200000, with tick marks at 0, 50000, 100000, 150000, and 200000.
* **Y-axis:** "Max Logits". The y-axis ranges from 0 to 100, with tick marks at 0, 20, 40, 60, 80, and 100.
* **Legend:** Located in the top-right corner, the legend identifies the blue line as "Kimi K2 with MuonClip".
### Detailed Analysis
* **Kimi K2 with MuonClip (Blue Line):**
* **Trend:** The line initially increases sharply from approximately 0 to around 100 Max Logits between 0 and 20000 Training Steps. It then plateaus at approximately 100 Max Logits until around 50000 Training Steps. After that, it decreases significantly to approximately 30 Max Logits by around 100000 Training Steps. Finally, it stabilizes around 30 Max Logits for the remainder of the training steps, with some fluctuations.
* **Data Points (Approximate):**
* (0, 0)
* (20000, 100)
* (50000, 100)
* (100000, 30)
* (200000, 30)
### Key Observations
* The model "Kimi K2 with MuonClip" initially learns quickly, reaching a high "Max Logits" value.
* The performance of the model degrades significantly after approximately 50000 training steps.
* The model stabilizes at a lower performance level after the degradation.
### Interpretation
The chart suggests that "Kimi K2 with MuonClip" experiences a period of rapid learning, followed by a phase where its performance deteriorates before stabilizing. This could be due to overfitting, a change in the training data distribution, or some other factor affecting the learning process. The initial rapid increase indicates successful initial learning, while the subsequent decline suggests a problem that needs to be addressed, such as adjusting the learning rate, regularization, or data augmentation. The stabilization at a lower level indicates that the model is still learning, but not as effectively as initially.