## Line Graph: Kimi K2 with MuonClip Training Logits
### Overview
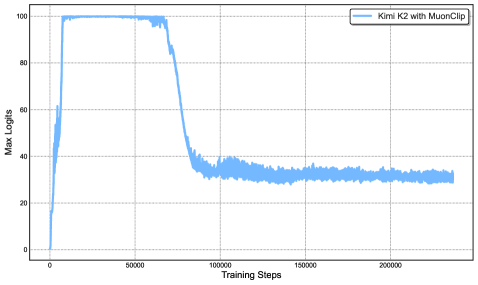
The image depicts a line graph tracking the "Max Logits" of a model named "Kimi K2 with MuonClip" across 200,000 training steps. The graph shows a sharp initial decline in logit values, followed by stabilization at a lower level.
### Components/Axes
- **X-axis (Training Steps)**: Labeled "Training Steps," ranging from 0 to 200,000 in increments of 50,000. Grid lines are present for reference.
- **Y-axis (Max Logits)**: Labeled "Max Logits," scaled from 0 to 100 in increments of 20. Grid lines are present.
- **Legend**: Located in the top-right corner, labeled "Kimi K2 with MuonClip" with a blue line indicator.
- **Line**: A single blue line representing the "Max Logits" metric.
### Detailed Analysis
- **Initial Phase (0–50,000 steps)**: The line starts at **100 logits** and drops sharply to approximately **30 logits** by 50,000 steps. The decline is steep, with a near-vertical slope in the first 10,000 steps.
- **Stabilization Phase (50,000–200,000 steps)**: After 50,000 steps, the line plateaus around **30 logits**, with minor fluctuations (±2 logits) observed between 100,000 and 200,000 steps. No significant upward or downward trends are visible in this phase.
### Key Observations
1. **Sharp Initial Decline**: The logits decrease by ~70% within the first 50,000 steps, suggesting rapid adaptation or optimization during early training.
2. **Stable Plateau**: The metric stabilizes at ~30 logits for the remaining 150,000 steps, indicating convergence or saturation of the model's performance.
3. **No Overtraining Signs**: The absence of further decline or oscillation after 50,000 steps suggests the model reached a stable state without overfitting.
### Interpretation
The graph demonstrates that "Kimi K2 with MuonClip" undergoes a significant performance drop in its early training phase, likely due to aggressive optimization or regularization. The subsequent stabilization at ~30 logits implies the model achieved a balanced state, possibly reflecting a trade-off between accuracy and generalization. The lack of further improvement or degradation after 50,000 steps suggests the training process effectively converged, though the exact cause of the initial drop (e.g., learning rate adjustments, data distribution shifts) is not specified. This pattern is critical for understanding the model's training dynamics and potential limitations in scalability or robustness.