\n
## Scatter Plots: Reasoning Skill Analysis
### Overview
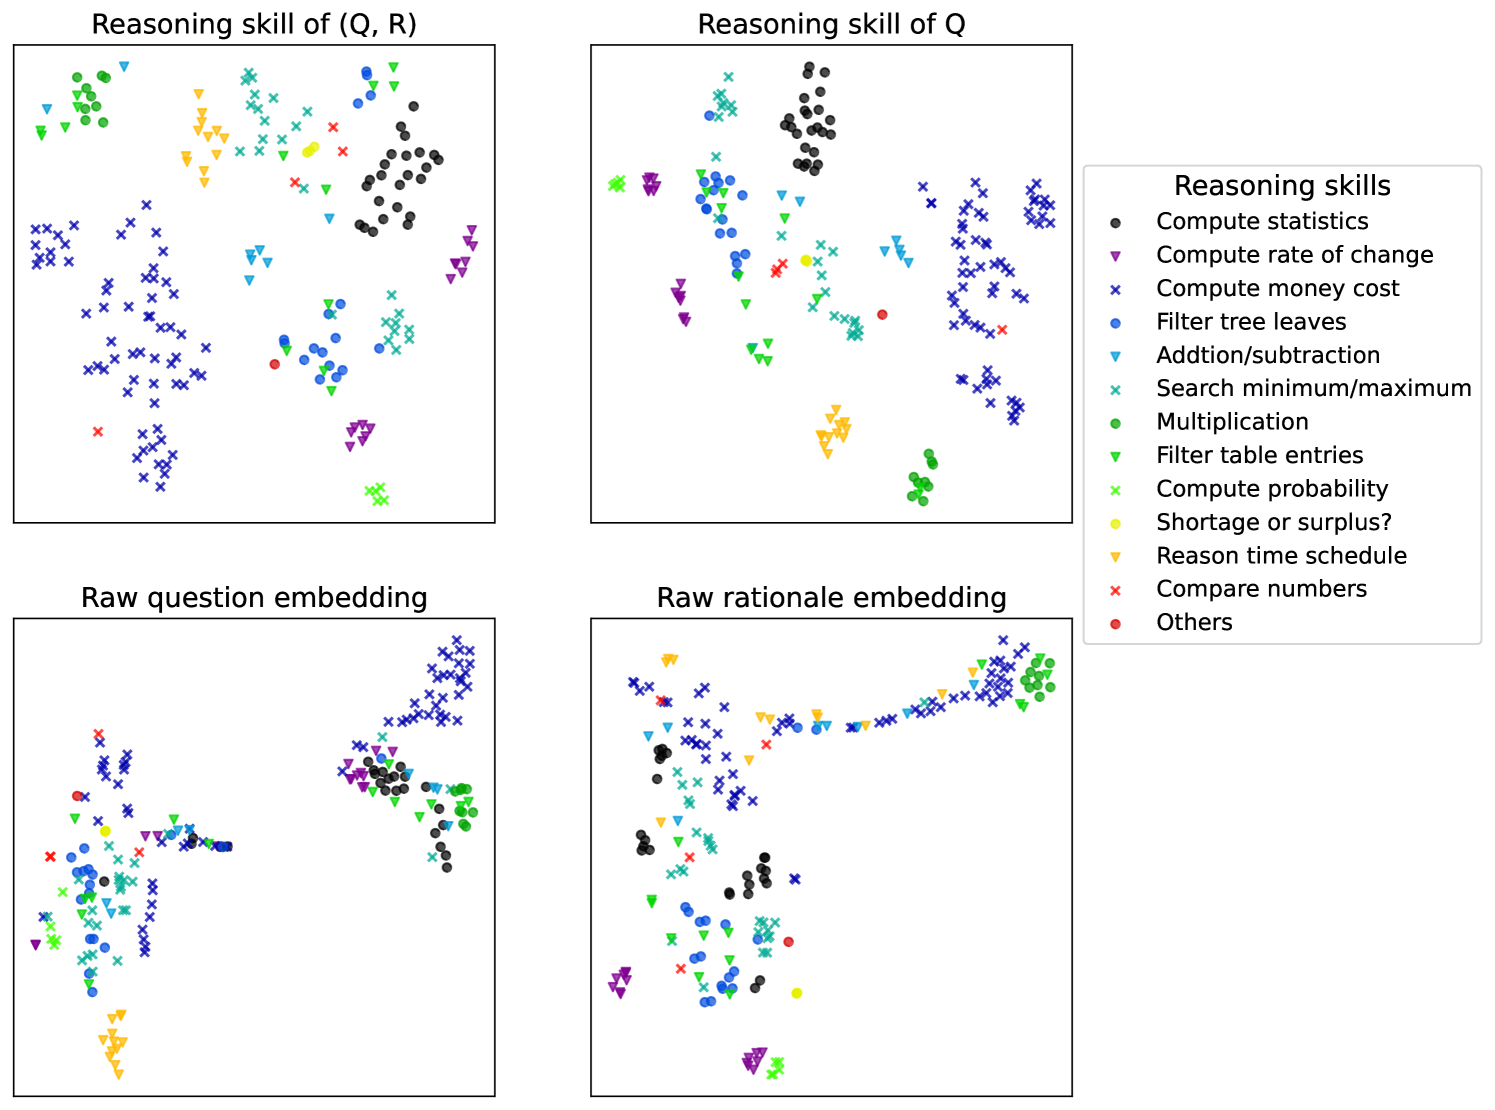
The image presents four scatter plots, arranged in a 2x2 grid. Each plot visualizes the distribution of different reasoning skills, represented by various marker types and colors. The plots are labeled "Reasoning skill of (Q, R)", "Reasoning skill of Q", "Raw question embedding", and "Raw rationale embedding". A legend in the top-right corner identifies the reasoning skills corresponding to each marker type and color.
### Components/Axes
Each scatter plot has two implicit axes, representing the x and y coordinates of the data points. The axes are not explicitly labeled with numerical scales or titles, suggesting the focus is on the relative distribution of skills rather than precise values. The legend, positioned in the top-right corner, lists the following reasoning skills:
* Compute statistics (Black circle)
* Compute rate of change (Purple triangle)
* Compute money cost (Grey 'x')
* Filter tree leaves (Blue plus)
* Addition/subtraction (Green diamond)
* Search minimum/maximum (Brown star)
* Multiplication (Orange circle)
* Filter table entries (Light blue inverted triangle)
* Compute probability (Yellow circle)
* Shortage or surplus? (Red triangle)
* Reason time schedule (Purple 'x')
* Compare numbers (Pink diamond)
* Others (Grey circle)
### Detailed Analysis or Content Details
**1. Reasoning skill of (Q, R)**
* The plot shows a relatively even distribution of most skills.
* 'Compute statistics' (black circles) are concentrated in the bottom-left quadrant.
* 'Addition/subtraction' (green diamonds) are scattered throughout the plot, with a slight concentration in the top-right.
* 'Compute probability' (yellow circles) are clustered in the top-left.
* 'Shortage or surplus?' (red triangles) are sparsely distributed.
* 'Others' (grey circles) are scattered throughout the plot.
**2. Reasoning skill of Q**
* 'Compute statistics' (black circles) are concentrated in the bottom-left quadrant.
* 'Addition/subtraction' (green diamonds) are scattered throughout the plot, with a slight concentration in the top-right.
* 'Compute probability' (yellow circles) are clustered in the top-left.
* 'Shortage or surplus?' (red triangles) are sparsely distributed.
* 'Others' (grey circles) are scattered throughout the plot.
**3. Raw question embedding**
* 'Compute statistics' (black circles) are concentrated in the bottom-left quadrant.
* 'Addition/subtraction' (green diamonds) are scattered throughout the plot, with a slight concentration in the top-right.
* 'Compute probability' (yellow circles) are clustered in the top-left.
* 'Shortage or surplus?' (red triangles) are sparsely distributed.
* 'Others' (grey circles) are scattered throughout the plot.
**4. Raw rationale embedding**
* 'Compute statistics' (black circles) are concentrated in the bottom-left quadrant.
* 'Addition/subtraction' (green diamonds) are scattered throughout the plot, with a slight concentration in the top-right.
* 'Compute probability' (yellow circles) are clustered in the top-left.
* 'Shortage or surplus?' (red triangles) are sparsely distributed.
* 'Others' (grey circles) are scattered throughout the plot.
### Key Observations
* The distribution of reasoning skills appears broadly similar across all four plots.
* 'Compute statistics' consistently appears in the bottom-left quadrant in all plots.
* 'Addition/subtraction' tends to be more dispersed, with a slight bias towards the top-right.
* 'Compute probability' consistently appears in the top-left quadrant in all plots.
* 'Shortage or surplus?' is the least represented skill in all plots.
### Interpretation
The plots likely represent a visualization of the distribution of reasoning skills required or demonstrated in a dataset of questions and rationales. The consistent patterns across the four plots suggest that the underlying distribution of skills is relatively stable, regardless of whether the analysis focuses on (Q, R), Q alone, the raw question embedding, or the raw rationale embedding.
The concentration of 'Compute statistics' in the bottom-left quadrant could indicate that this skill is often associated with lower-level or more fundamental reasoning tasks. Conversely, the dispersion of 'Addition/subtraction' might suggest that this skill is involved in a wider range of reasoning scenarios. The scarcity of 'Shortage or surplus?' could imply that this skill is less frequently required or assessed in the dataset.
The fact that the plots are not labeled with numerical scales suggests that the primary goal is to compare the *relative* prevalence of different skills, rather than to quantify their absolute frequency. The use of scatter plots allows for a visual assessment of the relationships between different skills, although without explicit axes, it is difficult to draw definitive conclusions about these relationships.