## Scatter Plot Grid: Reasoning Skills and Embeddings
### Overview
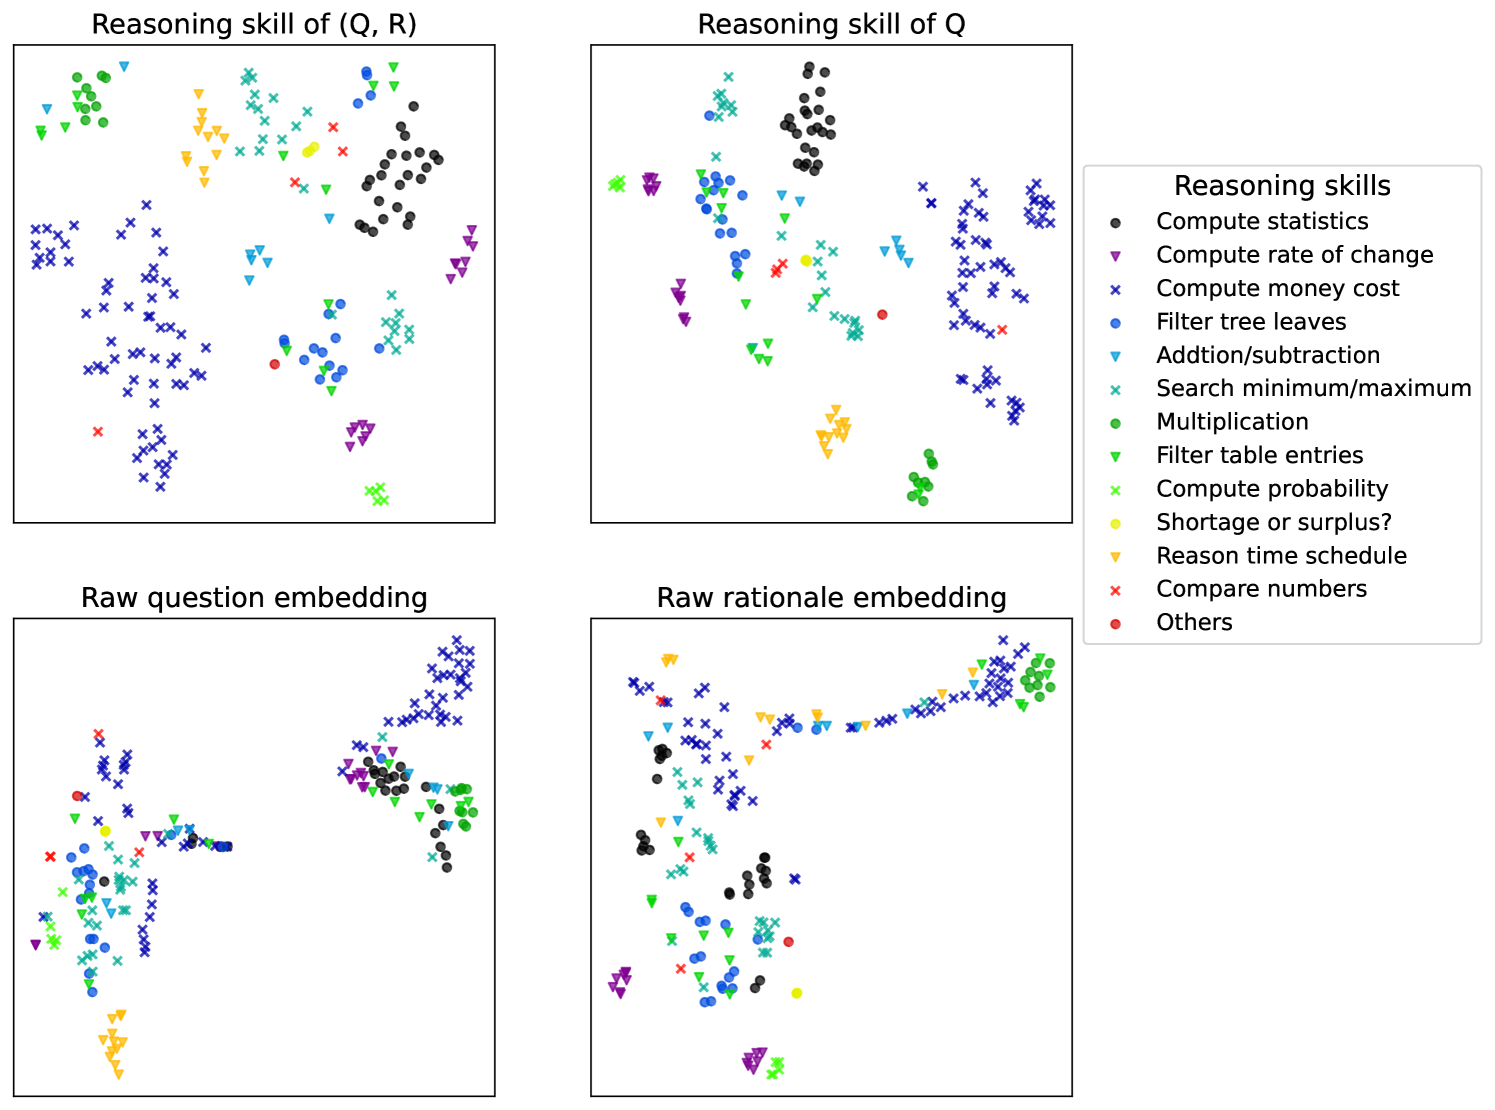
The image contains a 2x2 grid of scatter plots comparing reasoning skills and embeddings. Each plot uses distinct colored markers (circles, triangles, crosses) to represent different reasoning skills, with a shared legend on the right. The plots explore relationships between reasoning skills in different contexts: (Q, R), Q alone, raw question embeddings, and raw rationale embeddings.
### Components/Axes
- **Legend**: Located on the right side, mapping 13 reasoning skills to colors and symbols:
- **Black circles**: Compute statistics
- **Purple triangles**: Compute rate of change
- **Blue crosses**: Compute money cost
- **Teal triangles**: Filter tree leaves
- **Dark blue circles**: Addition/subtraction
- **Green triangles**: Search minimum/maximum
- **Yellow circles**: Multiplication
- **Light green crosses**: Filter table entries
- **Red circles**: Compute probability
- **Orange triangles**: Shortage or surplus?
- **Pink triangles**: Reason time schedule
- **Red crosses**: Compare numbers
- **Black dots**: Others
- **Subplots**:
1. **Top-left**: "Reasoning skill of (Q, R)" – Dense clusters of multiple skills.
2. **Top-right**: "Reasoning skill of Q" – Dominated by black circles (compute statistics) and purple triangles (compute rate of change).
3. **Bottom-left**: "Raw question embedding" – Overlapping distributions with teal triangles (filter tree leaves) and blue crosses (compute money cost) forming distinct clusters.
4. **Bottom-right**: "Raw rationale embedding" – Linear trend with black circles (compute statistics) and orange triangles (shortage or surplus?) concentrated in the lower-left.
### Detailed Analysis
- **Top-left Plot**:
- **Distribution**: Scattered points across the plot, with teal triangles (filter tree leaves) and green triangles (search minimum/maximum) forming tight clusters in the upper-right quadrant.
- **Trends**: No clear linear relationship; skills are broadly dispersed.
- **Top-right Plot**:
- **Distribution**: Black circles (compute statistics) dominate the center, while purple triangles (compute rate of change) cluster in the upper-right. Blue crosses (compute money cost) are sparse.
- **Trends**: Compute statistics is the most frequent skill, followed by compute rate of change.
- **Bottom-left Plot**:
- **Distribution**: Teal triangles (filter tree leaves) and blue crosses (compute money cost) form distinct clusters in the lower-left and upper-right, respectively. Overlap occurs in the central region.
- **Trends**: Filter tree leaves and compute money cost are spatially separated, suggesting distinct embeddings.
- **Bottom-right Plot**:
- **Distribution**: Black circles (compute statistics) and orange triangles (shortage or surplus?) form a linear trend from lower-left to upper-right. Red crosses (compare numbers) cluster in the lower-right.
- **Trends**: Compute statistics and shortage/surplus? show a positive correlation.
### Key Observations
1. **Dominant Skills**: Compute statistics (black circles) appears most frequently across all plots.
2. **Clustering**: Skills like filter tree leaves (teal triangles) and compute money cost (blue crosses) show spatial separation in raw embeddings.
3. **Linear Relationship**: Compute statistics and shortage/surplus? exhibit a positive correlation in raw rationale embeddings.
4. **Symbol Consistency**: Symbols (circles, triangles, crosses) align with legend labels but lack explicit explanation for their meaning (e.g., data type or group).
### Interpretation
The plots suggest that reasoning skills are context-dependent:
- **Q vs. (Q, R)**: Skills like compute rate of change (purple triangles) are more prominent when considering only Q, while (Q, R) introduces additional skills like filter tree leaves (teal triangles).
- **Embedding Relationships**: Raw question and rationale embeddings reveal distinct clusters for certain skills (e.g., filter tree leaves vs. compute money cost), indicating separable features in the data.
- **Linear Correlation**: The positive trend between compute statistics and shortage/surplus? in raw rationale embeddings implies these skills may share underlying features or are often co-occurring in reasoning tasks.
**Uncertainties**:
- Axis labels are missing, preventing quantification of trends.
- Symbol meanings (circles vs. triangles vs. crosses) are not explained, limiting interpretation of groupings.
- Exact numerical values cannot be extracted without axis scales.