## Horizontal Bar Charts: Distribution of Differences by T-Parameter
### Overview
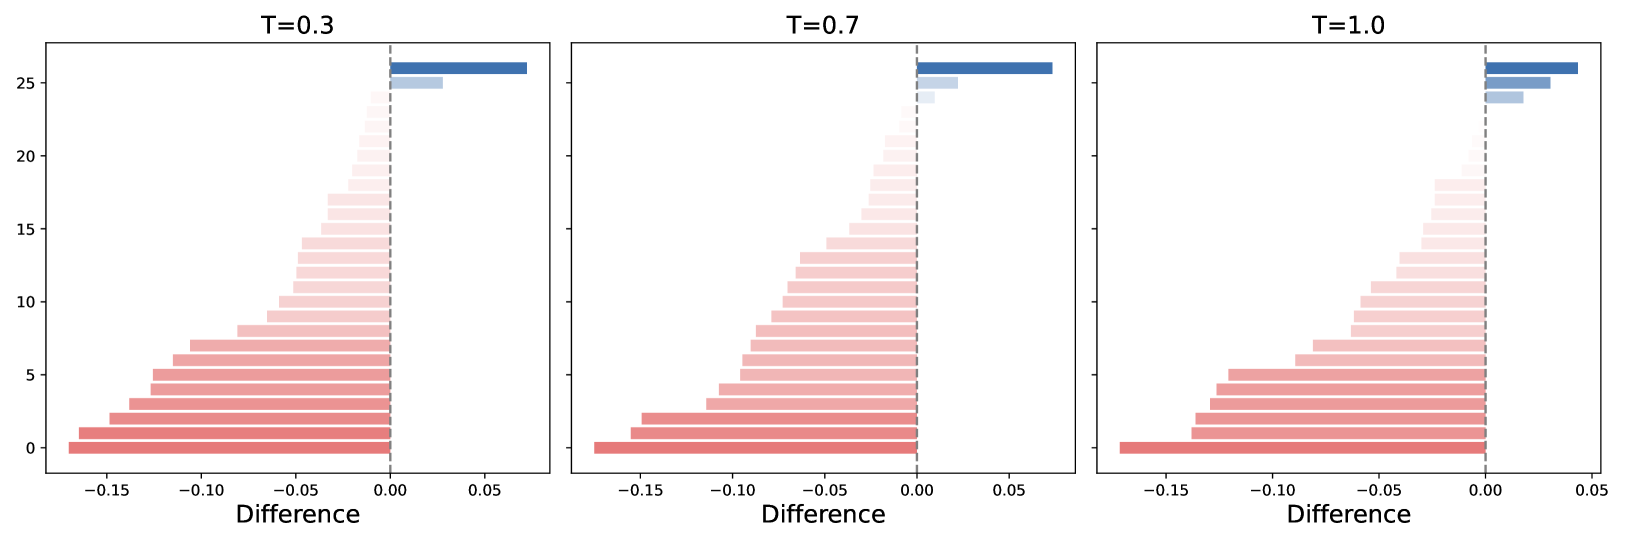
The image displays three side-by-side horizontal bar charts, each representing a dataset indexed from 0 to approximately 27. The charts compare the "Difference" (x-axis) for three distinct conditions labeled at the top of each chart: **T=0.3**, **T=0.7**, and **T=1.0**. The charts visualize a diverging distribution where negative values (red bars) are plotted to the left of a central dashed line (at 0), and positive values (blue bars) are plotted to the right.
### Components/Axes
* **X-Axis:** Labeled "Difference" at the bottom of each chart. The scale is consistent across all three charts, ranging from approximately -0.15 to +0.05.
* **Y-Axis:** Unlabeled, representing an index or category count. The axis is marked with ticks at 0, 5, 10, 15, 20, and 25. The bars extend up to index 26/27.
* **Reference Line:** A vertical dashed gray line at X=0 serves as the origin point for all bars.
* **Color Coding:**
* **Red/Pink:** Represents negative values (left of the dashed line).
* **Blue:** Represents positive values (right of the dashed line).
* **Layout:** The charts are arranged horizontally, with T=0.3 on the left, T=0.7 in the center, and T=1.0 on the right.
### Detailed Analysis
#### Chart 1: T=0.3
* **Trend:** The bars are sorted by magnitude. The negative values (red) are concentrated at the lower indices (0–24), while positive values (blue) are at the highest indices (25–26).
* **Negative Values:** The longest negative bar is at index 0, with a value of approximately -0.17. The magnitude decreases as the index increases toward 24.
* **Positive Values:** There are two positive bars at the top (indices 25 and 26). The longest positive bar is at index 26, with a value of approximately +0.07.
#### Chart 2: T=0.7
* **Trend:** Similar to T=0.3, the bars are sorted by magnitude.
* **Negative Values:** The longest negative bar is at index 0, with a value of approximately -0.14. This is slightly less negative than the corresponding bar in the T=0.3 chart.
* **Positive Values:** There are three positive bars at the top (indices 24, 25, and 26). The longest positive bar is at index 26, with a value of approximately +0.07.
#### Chart 3: T=1.0
* **Trend:** Similar to the previous charts, the bars are sorted by magnitude.
* **Negative Values:** The longest negative bar is at index 0, with a value of approximately -0.17, returning to a magnitude similar to T=0.3.
* **Positive Values:** There are three positive bars at the top (indices 24, 25, and 26). The longest positive bar is at index 26, with a value of approximately +0.04, which is lower than the positive peaks in the other two charts.
### Key Observations
* **Distribution Shift:** As the T-parameter increases from 0.3 to 0.7, the number of positive (blue) bars increases from 2 to 3.
* **Magnitude Variance:** The maximum negative difference is highest (most negative) at T=0.3 and T=1.0 (~ -0.17), while T=0.7 shows a slightly smaller maximum negative difference (~ -0.14).
* **Positive Peak:** The maximum positive difference is highest at T=0.3 and T=0.7 (~ +0.07) and decreases at T=1.0 (~ +0.04).
### Interpretation
The data suggests that "T" likely represents a temperature or threshold parameter in a model (such as a softmax temperature or a decision threshold).
* **Sensitivity:** The system is sensitive to the T-parameter, as evidenced by the shifting number of positive outcomes (the blue bars) and the fluctuating magnitudes of the differences.
* **Stability:** The overall structure (the "shape" of the distribution) remains relatively stable across all three T-values, indicating that while the specific values change, the underlying ranking or sorting of the data points is robust.
* **Trade-offs:** There appears to be a trade-off between the magnitude of the positive differences and the number of positive instances. At T=1.0, the system produces more positive instances (3 bars) but with lower individual magnitudes compared to T=0.3. This is characteristic of "smoothing" or "flattening" effects often seen when increasing temperature parameters in probabilistic models.