## RAG System Comparison Diagram
### Overview
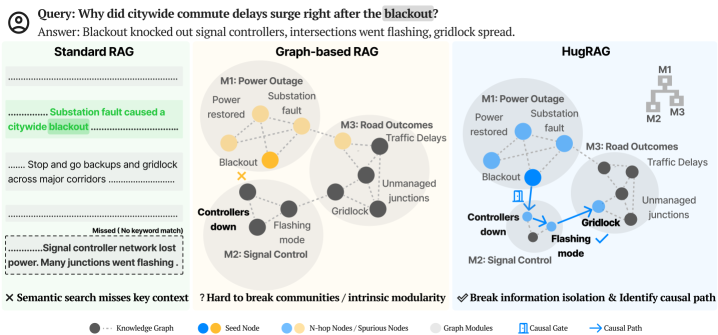
The image presents a comparison of three different Retrieval-Augmented Generation (RAG) systems: Standard RAG, Graph-based RAG, and HugRAG. It illustrates how each system handles the query "Why did citywide commute delays surge right after the blackout?" by showing the flow of information and the connections between different concepts. The diagram highlights the strengths and weaknesses of each approach in terms of context retrieval and causal reasoning.
### Components/Axes
* **Title:** Query: Why did citywide commute delays surge right after the blackout?
Answer: Blackout knocked out signal controllers, intersections went flashing, gridlock spread.
* **RAG Systems:**
* Standard RAG
* Graph-based RAG
* HugRAG
* **Nodes:** Represent concepts or entities.
* **Edges:** Represent relationships between concepts.
* **Modules:** M1: Power Outage, M2: Signal Control, M3: Road Outcomes
* **Legend:** Located at the bottom of the image.
* Knowledge Graph (gray dotted line)
* Seed Node (blue circle)
* N-hop Nodes / Spurious Nodes (yellow circle)
* Graph Modules (light gray shaded area)
* Causal Gate (blue icon of a gate)
* Causal Path (blue arrow)
### Detailed Analysis
**1. Standard RAG (Left)**
* **Description:** This system retrieves text snippets based on keyword matching.
* **Text Snippets:**
* "Substation fault caused a citywide blackout" (highlighted in green)
* "Stop and go backups and gridlock across major corridors"
* "Signal controller network lost power. Many junctions went flashing." (marked as "Missed (No keyword match)")
* **Analysis:** The system successfully retrieves information about the blackout but misses the connection between signal controller failure and traffic delays.
* **Semantic Search:** "X Semantic search misses key context"
**2. Graph-based RAG (Center)**
* **Description:** This system uses a knowledge graph to represent relationships between concepts.
* **Modules:**
* M1: Power Outage (Power restored, Substation fault, Blackout)
* M2: Signal Control (Controllers down, Flashing mode)
* M3: Road Outcomes (Traffic Delays, Unmanaged junctions, Gridlock)
* **Nodes:**
* Blackout (marked with an "X")
* Controllers down
* Flashing mode
* Gridlock
* Unmanaged junctions
* Traffic Delays
* Power restored
* Substation fault
* **Analysis:** The system represents the relationships between power outage, signal control, and road outcomes. However, it struggles to identify the causal path.
* **Community Breaking:** "? Hard to break communities / intrinsic modularity"
**3. HugRAG (Right)**
* **Description:** This system combines knowledge graph representation with causal reasoning.
* **Modules:**
* M1: Power Outage (Power restored, Substation fault, Blackout)
* M2: Signal Control (Controllers down, Flashing mode)
* M3: Road Outcomes (Traffic Delays, Unmanaged junctions, Gridlock)
* **Nodes:**
* Blackout
* Controllers down
* Flashing mode
* Gridlock
* Unmanaged junctions
* Traffic Delays
* Power restored
* Substation fault
* **Causal Path:** A blue arrow indicates the causal path from "Blackout" to "Controllers down" to "Flashing mode" to "Gridlock" to "Traffic Delays".
* **Causal Gate:** A blue gate icon is present between "Blackout" and "Controllers down".
* **Analysis:** The system successfully identifies the causal path from the blackout to traffic delays through signal controller failure.
* **Information Isolation:** "✓ Break information isolation & Identify causal path"
### Key Observations
* Standard RAG relies on keyword matching and misses contextual information.
* Graph-based RAG represents relationships but struggles with causal reasoning.
* HugRAG combines graph representation with causal reasoning to identify the causal path.
### Interpretation
The diagram demonstrates the evolution of RAG systems from simple keyword-based retrieval to more sophisticated approaches that incorporate knowledge graphs and causal reasoning. HugRAG appears to be the most effective system, as it successfully identifies the causal path between the blackout and traffic delays. This suggests that incorporating causal reasoning into RAG systems can improve their ability to answer complex questions and provide more informative responses. The "Causal Gate" likely represents a point where causal inference is applied to determine the most likely cause-and-effect relationship. The diagram highlights the importance of context and causal reasoning in information retrieval and generation.