\n
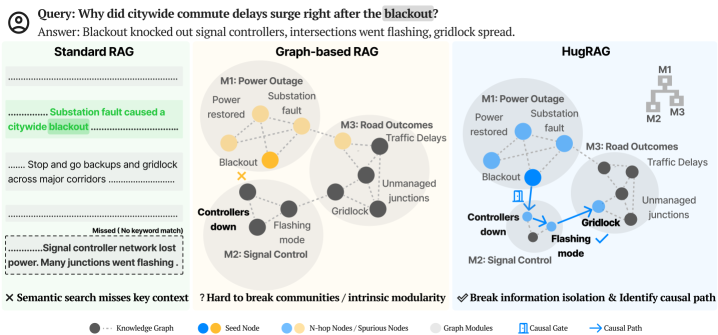
## Diagram: RAG Model Comparison for Blackout Analysis
### Overview
The image presents a comparative diagram illustrating three different Retrieval-Augmented Generation (RAG) models – Standard RAG, Graph-based RAG, and HugRAG – in the context of analyzing the causes of citywide commute delays following a blackout. Each model is represented with a network diagram showing the relationships between events and factors contributing to the delays. The diagram highlights the strengths and weaknesses of each approach in identifying the key causal pathways.
### Components/Axes
The diagram is divided into three main sections, one for each RAG model. Each section includes a network diagram and accompanying text describing the model's output and limitations.
**Common Elements:**
* **Nodes:** Represent concepts or events (e.g., "Blackout", "Traffic Delays", "Power restored").
* **Edges:** Represent relationships between nodes.
* **Color Coding:**
* Green: Knowledge Graph
* Blue: Seed Node
* Gray: N-hop Nodes / Spurious Nodes
* Orange: Graph Modules
* Teal: Causal Gate
* Purple: Causal Path
* **Icons:**
* "X": Semantic search misses key context
* "?": Hard to break communities / intrinsic modularity
* Checkmark: Break information isolation & Identify causal path
**Specific Labels:**
* **Query:** "Why did citywide commute delays surge right after the blackout?"
* **Answer:** "Blackout knocked out signal controllers, intersections went flashing, gridlock spread."
* **M1:** Power Outage
* **M2:** Signal Control
* **M3:** Road Outcomes
* **Substation fault caused a citywide blackout**
* **Stop and go backups and gridlock across major corridors**
* **Missed (No keyword match)**
* **Signal controller network lost power. Many junctions went flashing.**
### Detailed Analysis or Content Details
**1. Standard RAG (Left)**
* The diagram shows a simple linear connection between "Substation fault" and "citywide blackout".
* Further connections lead to "Stop and go backups and gridlock across major corridors".
* A dashed box indicates "Missed (No keyword match)" and a text bubble states "Signal controller network lost power. Many junctions went flashing." indicating a failure to identify this key connection.
* The network is relatively sparse, with limited connections beyond the primary path.
**2. Graph-based RAG (Center)**
* The diagram displays a more complex network with multiple interconnected nodes.
* "Blackout" is central, connected to "Controllers down", "Flashing mode", and "Gridlock".
* "Power restored" is connected to "Substation fault".
* "Traffic Delays" and "Unmanaged junctions" are linked to "Gridlock".
* A question mark icon indicates "Hard to break communities / intrinsic modularity".
* The diagram shows a larger number of nodes and edges compared to Standard RAG.
**3. HugRAG (Right)**
* Similar network structure to Graph-based RAG, but with the addition of a hierarchical structure represented by a tree diagram in the top-right corner (M1, M2, M3).
* A checkmark icon indicates "Break information isolation & Identify causal path".
* A blue arrow highlights the causal path from "Blackout" to "Gridlock" via "Flashing mode".
* The diagram appears to emphasize the causal relationships between events.
### Key Observations
* Standard RAG struggles to identify the full context of the blackout, missing the connection to signal controller failures.
* Graph-based RAG provides a more comprehensive view of the relationships but faces challenges in breaking down complex communities.
* HugRAG appears to be the most effective in identifying the causal path and breaking information isolation.
* The complexity of the network diagrams increases from Standard RAG to Graph-based RAG to HugRAG, reflecting the increasing sophistication of the models.
### Interpretation
The diagram demonstrates the varying capabilities of different RAG models in analyzing complex events like a citywide blackout. Standard RAG, relying on keyword matching, fails to capture the nuanced relationships between events. Graph-based RAG improves upon this by leveraging a knowledge graph, but struggles with modularity. HugRAG, by combining graph-based reasoning with a hierarchical structure and causal path identification, provides the most complete and accurate understanding of the blackout's impact on commute delays. The diagram highlights the importance of considering causal relationships and breaking information isolation when building RAG models for complex problem-solving. The use of color-coding and icons effectively communicates the strengths and weaknesses of each approach. The diagram suggests that HugRAG is the most promising approach for analyzing complex events and providing actionable insights.