## Diagram: Comparison of RAG Methods for Blackout Analysis
### Overview
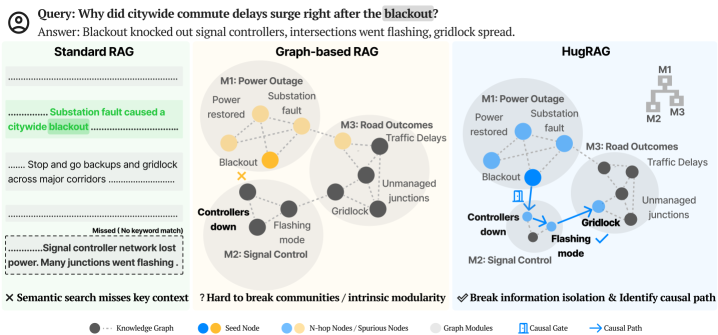
The image compares three Retrieval-Augmented Generation (RAG) methods—Standard RAG, Graph-based RAG, and HugRAG—using diagrams and text to explain how each handles a query about citywide commute delays caused by a blackout. The diagrams use color-coded nodes and connections to represent knowledge graphs, causal relationships, and modularity.
---
### Components/Axes
1. **Query & Answer Section**
- **Text**:
- Query: *"Why did citywide commute delays surge right after the blackout?"*
- Answer: *"Blackout knocked out signal controllers, intersections went flashing, gridlock spread."*
- **Highlighted Text**:
- *"Substation fault caused a citywide blackout"* (Standard RAG)
- *"Signal controller network lost power. Many junctions went flashing"* (Standard RAG)
2. **Standard RAG Diagram**
- **Text**:
- *"Substation fault caused a citywide blackout"*
- *"Stop and go backups and gridlock across major corridors"*
- *"Signal controller network lost power. Many junctions went flashing"*
- **Color Legend**:
- Black dots: Knowledge Graph
- Blue: Seed Node
- Yellow: N-hop Nodes (Spurious Nodes)
- Gray: Graph Modules
- Blue arrows: Causal Gate
- Blue arrows with checkmark: Causal Path
3. **Graph-based RAG Diagram**
- **Nodes**:
- **M1**: Power Outage (yellow), Substation restored (yellow), Blackout (yellow)
- **M2**: Signal Control (black), Controllers down (black), Flashing mode (black)
- **M3**: Road Outcomes (black), Traffic Delays (black), Unmanaged junctions (black)
- **Connections**:
- M1 → M2 (Power Outage → Signal Control)
- M2 → M3 (Gridlock → Traffic Delays)
- **Text**:
- *"Hard to break communities / intrinsic modularity"*
4. **HugRAG Diagram**
- **Nodes**:
- **M1**: Power Outage (blue), Substation restored (blue), Blackout (blue)
- **M2**: Signal Control (black), Controllers down (black), Flashing mode (black)
- **M3**: Road Outcomes (black), Traffic Delays (black), Unmanaged junctions (black)
- **Connections**:
- M1 → M2 → M3 (Causal Path: Power Outage → Signal Control → Traffic Delays)
- **Text**:
- *"Break information isolation & Identify causal path"*
---
### Detailed Analysis
1. **Standard RAG**
- **Text Content**:
- Highlights "Substation fault caused a citywide blackout" and "Signal controller network lost power."
- Misses key context: *"Semantic search misses key context"* (marked with an X).
- **Diagram**:
- No explicit nodes or connections. Relies on textual summaries.
2. **Graph-based RAG**
- **Nodes**:
- **M1 (Power Outage)**: Yellow (Seed Node)
- **M2 (Signal Control)**: Black (Knowledge Graph)
- **M3 (Road Outcomes)**: Black (Knowledge Graph)
- **Connections**:
- M1 → M2 (Power Outage → Signal Control)
- M2 → M3 (Gridlock → Traffic Delays)
- **Text**:
- *"Hard to break communities / intrinsic modularity"* (indicates limitations in modularity).
3. **HugRAG**
- **Nodes**:
- **M1 (Power Outage)**: Blue (N-hop Node)
- **M2 (Signal Control)**: Black (Knowledge Graph)
- **M3 (Road Outcomes)**: Black (Knowledge Graph)
- **Connections**:
- M1 → M2 → M3 (Causal Path: Power Outage → Signal Control → Traffic Delays)
- **Text**:
- *"Break information isolation & Identify causal path"* (emphasizes causal reasoning).
---
### Key Observations
1. **Standard RAG**
- Relies on text summaries but fails to capture causal relationships (e.g., "Semantic search misses key context").
- Highlights critical events (substation fault, signal controller failure) but lacks structural analysis.
2. **Graph-based RAG**
- Uses nodes to represent events (e.g., Power Outage, Signal Control) and connections to show relationships.
- Struggles with modularity ("Hard to break communities"), suggesting difficulty in isolating specific causal chains.
3. **HugRAG**
- Explicitly identifies a **causal path** (M1 → M2 → M3) using blue arrows with checkmarks.
- Combines modularity (graph modules) with causal reasoning (causal gates).
---
### Interpretation
1. **Standard RAG**
- Provides a basic summary but lacks depth in explaining causality. Its failure to capture key context (e.g., "signal controller network lost power") suggests limitations in retrieval precision.
2. **Graph-based RAG**
- Represents events as nodes and relationships as edges but cannot fully disentangle modular components (e.g., "intrinsic modularity" issue). This may lead to incomplete or fragmented explanations.
3. **HugRAG**
- Outperforms others by explicitly tracing the causal chain (Power Outage → Signal Control → Traffic Delays). The use of **causal gates** and **causal paths** indicates a structured approach to linking events, making it more effective for complex queries.
4. **Color Coding Significance**
- **Yellow (Seed Nodes)**: Highlight critical events (e.g., Power Outage) in Graph-based RAG.
- **Blue (N-hop Nodes)**: Represent intermediate steps in HugRAG’s causal path.
- **Black (Knowledge Graph)**: Core events (e.g., Signal Control) are consistently marked across methods.
---
### Conclusion
The diagram illustrates how HugRAG’s integration of causal reasoning and modularity surpasses Standard RAG and Graph-based RAG in explaining complex, interconnected events like blackouts. By breaking information isolation and identifying causal paths, HugRAG provides a more accurate and structured analysis of the root causes and consequences of citywide commute delays.