## Threshold vs. Signal Duration for Different Frequencies
### Overview
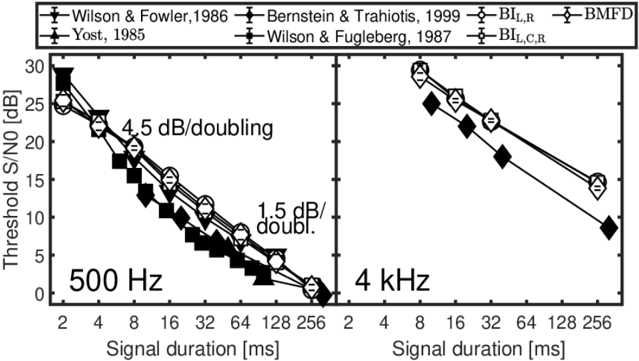
The image presents two line graphs comparing the threshold signal-to-noise ratio (S/N0) in decibels (dB) against the signal duration in milliseconds (ms) for two different frequencies: 500 Hz and 4 kHz. Each graph displays data from multiple studies, identified by author and year, showing how the threshold changes with signal duration.
### Components/Axes
* **Title:** Threshold S/N0 [dB]
* **X-axis:** Signal duration [ms] (Logarithmic scale)
* Values: 2, 4, 8, 16, 32, 64, 128, 256
* **Y-axis:** Threshold S/N0 [dB]
* Values: 0, 5, 10, 15, 20, 25, 30
* **Graphs:** Two graphs, one for 500 Hz and one for 4 kHz.
* **Legend (Top):**
* Wilson & Fowler, 1986 (Line with error bars)
* Yost, 1985 (Line with triangle markers)
* Bernstein & Trahiotis, 1999 (Line with diamond markers)
* BI<sub>L,R</sub> (Line with circle markers containing a horizontal line)
* BMFD (Line with diamond markers containing a horizontal line)
* Wilson & Fugleberg, 1987 (Line with square markers)
* BI<sub>L,C,R</sub> (Line with circle markers containing a horizontal line)
### Detailed Analysis
**500 Hz Graph:**
* **General Trend:** All data series show a decreasing threshold S/N0 as signal duration increases.
* **Wilson & Fowler, 1986:** Starts at approximately 28 dB at 2 ms and decreases to approximately 5 dB at 256 ms.
* **Yost, 1985:** Starts at approximately 29 dB at 2 ms and decreases to approximately 3 dB at 256 ms.
* **Bernstein & Trahiotis, 1999:** Starts at approximately 26 dB at 2 ms and decreases to approximately 8 dB at 256 ms.
* **BI<sub>L,R</sub>:** Starts at approximately 26 dB at 2 ms and decreases to approximately 6 dB at 256 ms.
* **BMFD:** Starts at approximately 26 dB at 2 ms and decreases to approximately 6 dB at 256 ms.
* **Wilson & Fugleberg, 1987:** Starts at approximately 24 dB at 2 ms and decreases to approximately 10 dB at 256 ms.
* **Rate of Change:** Text annotation indicates a rate of change of "4.5 dB/doubling" at shorter durations and "1.5 dB/doubl." at longer durations.
**4 kHz Graph:**
* **General Trend:** All data series show a decreasing threshold S/N0 as signal duration increases.
* **Bernstein & Trahiotis, 1999:** Starts at approximately 27 dB at 2 ms and decreases to approximately 12 dB at 256 ms.
* **BMFD:** Starts at approximately 27 dB at 2 ms and decreases to approximately 12 dB at 256 ms.
* **BI<sub>L,R</sub>:** Starts at approximately 24 dB at 2 ms and decreases to approximately 10 dB at 256 ms.
### Key Observations
* The threshold S/N0 generally decreases as the signal duration increases for both frequencies.
* The 500 Hz graph shows a steeper initial decrease in threshold compared to the 4 kHz graph.
* The data series from different studies show some variability, but the overall trend is consistent.
* The rate of change in threshold S/N0 with doubling of signal duration is higher at shorter durations for the 500 Hz frequency.
### Interpretation
The graphs illustrate the temporal integration properties of auditory perception. As the duration of a signal increases, the auditory system requires a lower signal-to-noise ratio to detect the signal. This effect is more pronounced at lower frequencies (500 Hz) compared to higher frequencies (4 kHz), as indicated by the steeper initial slope in the 500 Hz graph. The different studies show some variation in the absolute threshold values, which could be attributed to differences in experimental methodologies or participant populations. The annotations "4.5 dB/doubling" and "1.5 dB/doubl." suggest that the rate of temporal integration decreases as the signal duration increases, possibly reflecting different underlying neural mechanisms at different time scales.