## Line Graph: Threshold S/N0 vs. Signal Duration at 500 Hz and 4 kHz
### Overview
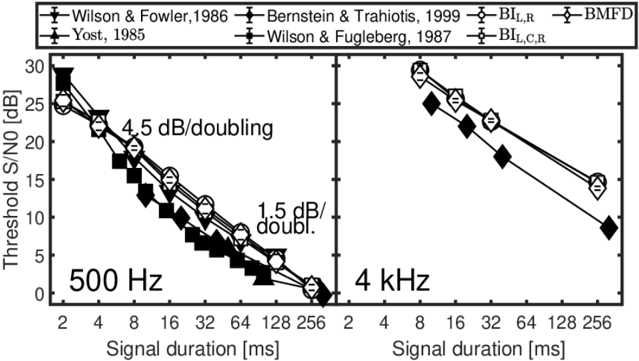
The image contains two side-by-side line graphs comparing threshold signal-to-noise ratio (S/N0) in decibels (dB) against signal duration in milliseconds (ms) for two frequencies: 500 Hz (left) and 4 kHz (right). Multiple data series are plotted, each representing different studies or methods, with distinct markers and line styles. The graphs show exponential decay trends, with annotations indicating dB/doubling rates.
---
### Components/Axes
- **X-axis**: "Signal duration [ms]" (logarithmic scale: 2, 4, 8, 16, 32, 64, 128, 256 ms)
- **Y-axis**: "Threshold S/N0 [dB]" (linear scale: 0–30 dB)
- **Legends**:
- **Left Plot (500 Hz)**:
- Wilson & Fowler, 1986 (black squares)
- Bernstein & Trahiotis, 1999 (black circles)
- Yost, 1985 (black diamonds)
- Wilson & Fugleberg, 1987 (black triangles)
- BI_L,R (white circles)
- BMFD (white diamonds)
- **Right Plot (4 kHz)**:
- Same legend entries as left plot, but only BI_L,R and BMFD are visible.
- **Annotations**:
- "4.5 dB/doubling" (left plot)
- "1.5 dB/doubling" (right plot)
---
### Detailed Analysis
#### Left Plot (500 Hz)
- **Trend**: Steeper exponential decay. All data series converge near 0 dB at 256 ms.
- **Key Data Points**:
- **Wilson & Fowler, 1986**: Starts at ~28 dB (2 ms), ends at ~1 dB (256 ms).
- **Bernstein & Trahiotis, 1999**: Starts at ~26 dB (2 ms), ends at ~0.5 dB (256 ms).
- **Yost, 1985**: Starts at ~24 dB (2 ms), ends at ~0 dB (256 ms).
- **Wilson & Fugleberg, 1987**: Starts at ~22 dB (2 ms), ends at ~0.5 dB (256 ms).
- **BI_L,R**: Starts at ~20 dB (2 ms), ends at ~0 dB (256 ms).
- **BMFD**: Starts at ~18 dB (2 ms), ends at ~0 dB (256 ms).
#### Right Plot (4 kHz)
- **Trend**: Slower exponential decay. Lines diverge slightly at longer durations.
- **Key Data Points**:
- **BI_L,R**: Starts at ~15 dB (2 ms), ends at ~5 dB (256 ms).
- **BMFD**: Starts at ~12 dB (2 ms), ends at ~3 dB (256 ms).
---
### Key Observations
1. **Frequency Dependence**: The 500 Hz plot shows a steeper decline (4.5 dB/doubling) compared to 4 kHz (1.5 dB/doubling), suggesting frequency-dependent sensitivity to signal duration.
2. **Convergence**: At 500 Hz, all methods converge near 0 dB at 256 ms, indicating diminishing returns for longer signals. At 4 kHz, divergence persists, implying sustained sensitivity.
3. **Method Variability**: At 500 Hz, Wilson & Fowler (1986) consistently reports the highest thresholds, while BI_L,R and BMFD show the lowest. At 4 kHz, BI_L,R and BMFD diverge, with BI_L,R maintaining higher thresholds.
---
### Interpretation
The data demonstrates that **longer signal durations improve threshold S/N0**, but the rate of improvement depends on frequency. At 500 Hz, all methods achieve near-optimal thresholds by 256 ms, suggesting saturation. At 4 kHz, thresholds remain elevated even at longer durations, indicating that higher frequencies may require additional signal processing or longer durations for optimal detection. The divergence between BI_L,R and BMFD at 4 kHz highlights methodological differences in handling higher-frequency signals. These findings could inform auditory system modeling or signal design for hearing aids.