# Technical Document Extraction: Scatter Plot Analysis
## Chart Description
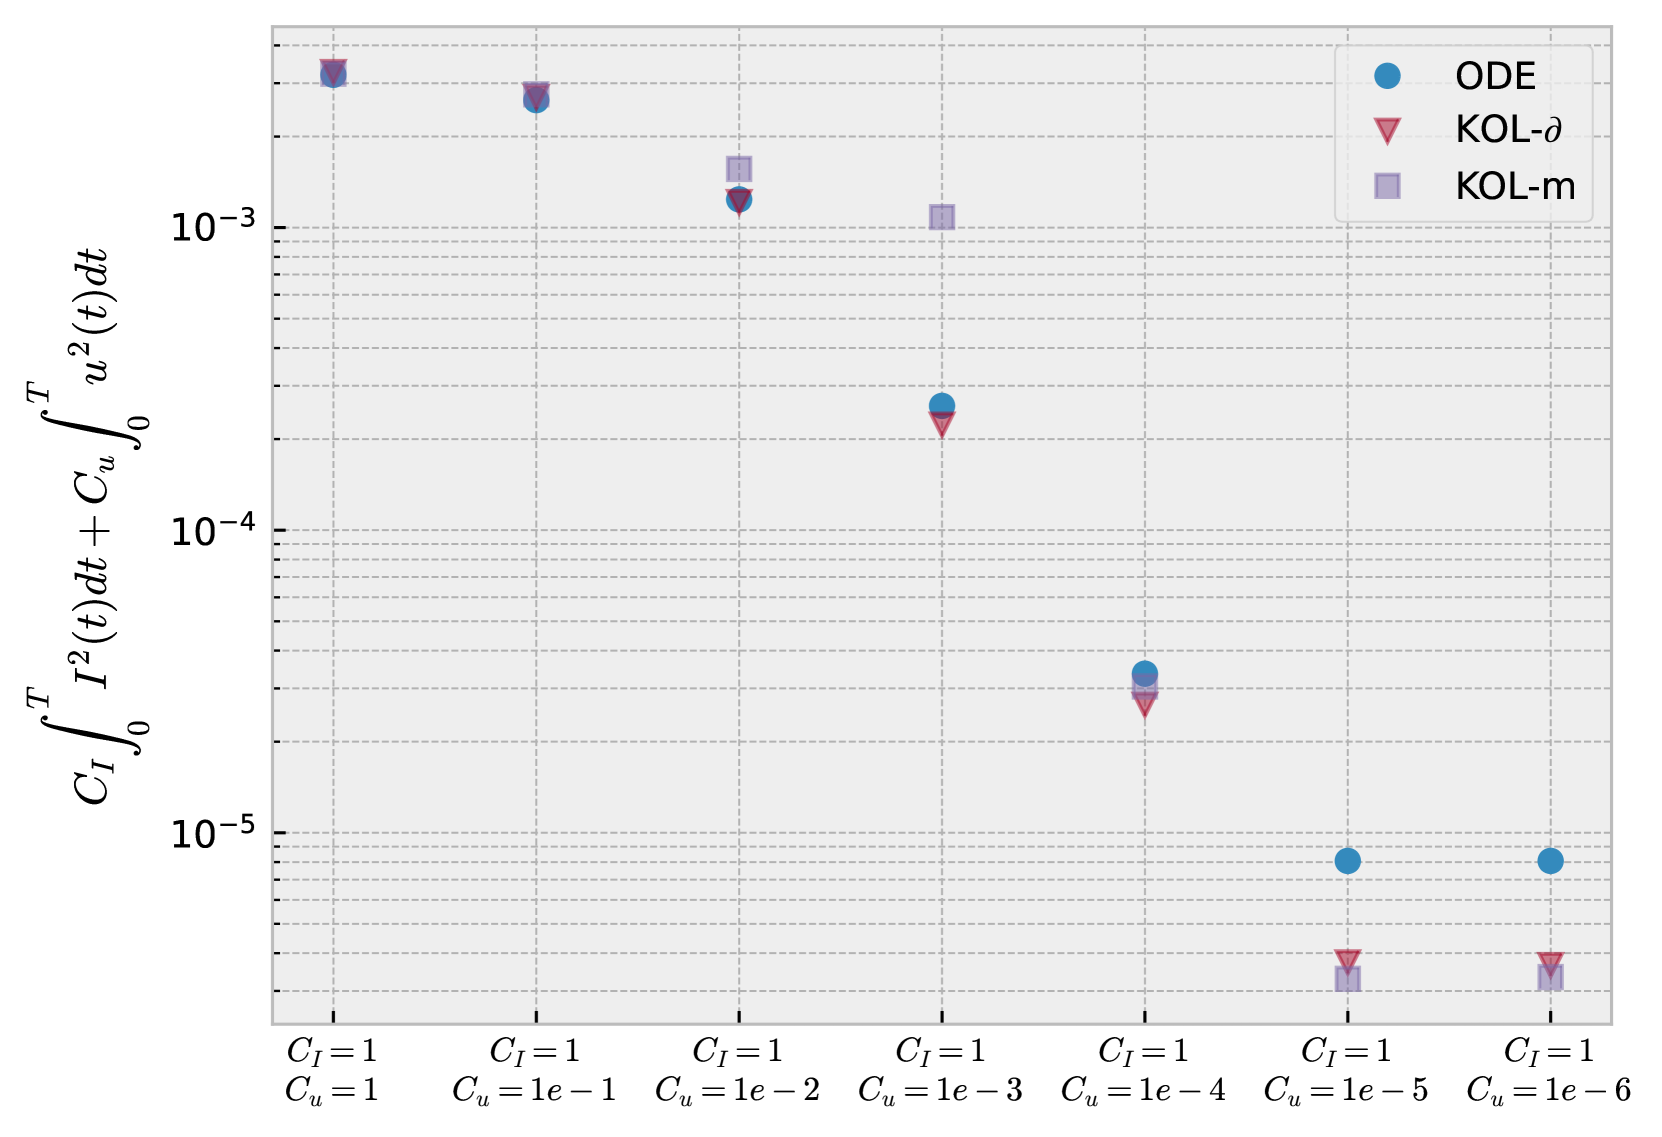
The image is a **scatter plot** comparing three methods (ODE, KOL-δ, KOL-m) across varying parameter combinations of \( C_I \) and \( C_u \). The y-axis represents a normalized integral metric, while the x-axis encodes parameter values.
---
### **Axis Labels and Scales**
- **Y-Axis**:
\( C_I \int_0^T I^2(t)dt + C_u \int_0^T u^2(t)dt \)
Logarithmic scale: \( 10^{-5} \) to \( 10^{-3} \).
- **X-Axis**:
Parameter combinations of \( C_I \) and \( C_u \):
- \( C_I = 1 \), \( C_u = 1 \)
- \( C_I = 1 \), \( C_u = 1e-1 \)
- \( C_I = 1 \), \( C_u = 1e-2 \)
- \( C_I = 1 \), \( C_u = 1e-3 \)
- \( C_I = 1 \), \( C_u = 1e-4 \)
- \( C_I = 1 \), \( C_u = 1e-5 \)
- \( C_I = 1 \), \( C_u = 1e-6 \)
---
### **Legend and Markers**
- **ODE**: Blue circles (●)
- **KOL-δ**: Red triangles (▼)
- **KOL-m**: Purple squares (■)
---
### **Data Points and Trends**
1. **\( C_I = 1 \), \( C_u = 1 \)**
- ODE: \( \sim 10^{-3} \)
- KOL-δ: \( \sim 10^{-3} \)
- KOL-m: \( \sim 10^{-3} \)
2. **\( C_I = 1 \), \( C_u = 1e-1 \)**
- ODE: \( \sim 10^{-3} \)
- KOL-δ: \( \sim 10^{-3} \)
- KOL-m: \( \sim 10^{-3} \)
3. **\( C_I = 1 \), \( C_u = 1e-2 \)**
- ODE: \( \sim 10^{-3} \)
- KOL-δ: \( \sim 10^{-3} \)
- KOL-m: \( \sim 10^{-3} \)
4. **\( C_I = 1 \), \( C_u = 1e-3 \)**
- ODE: \( \sim 10^{-4} \)
- KOL-δ: \( \sim 10^{-4} \)
- KOL-m: \( \sim 10^{-3} \)
5. **\( C_I = 1 \), \( C_u = 1e-4 \)**
- ODE: \( \sim 10^{-5} \)
- KOL-δ: \( \sim 10^{-5} \)
- KOL-m: \( \sim 10^{-3} \)
6. **\( C_I = 1 \), \( C_u = 1e-5 \)**
- ODE: \( \sim 10^{-5} \)
- KOL-δ: \( \sim 10^{-5} \)
- KOL-m: \( \sim 10^{-5} \)
7. **\( C_I = 1 \), \( C_u = 1e-6 \)**
- ODE: \( \sim 10^{-5} \)
- KOL-δ: \( \sim 10^{-5} \)
- KOL-m: \( \sim 10^{-5} \)
---
### **Key Observations**
- **ODE** (blue circles) consistently shows the highest values across all parameter combinations.
- **KOL-δ** (red triangles) and **KOL-m** (purple squares) exhibit similar trends but with slightly lower magnitudes than ODE.
- As \( C_u \) decreases (e.g., \( C_u = 1e-6 \)), all methods converge toward lower y-axis values, suggesting diminishing performance with reduced \( C_u \).
- The y-axis metric decreases exponentially with increasing \( C_u \), indicating sensitivity to \( C_u \) adjustments.
---
### **Cross-Referenced Legend Accuracy**
- Blue circles (ODE) align with the highest y-axis values.
- Red triangles (KOL-δ) and purple squares (KOL-m) are consistently lower, with KOL-m occasionally matching KOL-δ at extreme \( C_u \) values.