## Line Graphs: Margin vs. Recurrent Iteration for Different R Values
### Overview
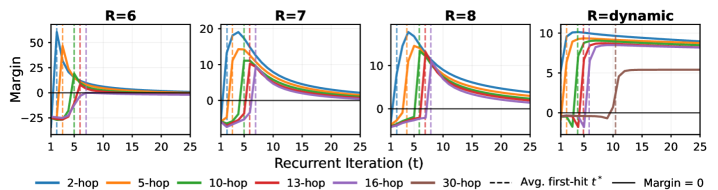
The image contains four line graphs comparing the "Margin" metric across recurrent iterations (t) for different system configurations labeled R=6, R=7, R=8, and R=dynamic. Each graph includes multiple colored lines representing different "hop" configurations (2-hop, 5-hop, 10-hop, etc.), with a legend at the bottom. Vertical dashed lines mark "Avg. first-hit t*" thresholds, and a horizontal line at Margin=0 serves as a reference.
### Components/Axes
- **X-axis**: Recurrent Iteration (t), ranging from 1 to 25.
- **Y-axis**: Margin, with scales varying per graph (e.g., -25 to 50 for R=6, -10 to 20 for R=7, etc.).
- **Legend**: Located at the bottom, mapping colors to hop configurations:
- Blue: 2-hop
- Orange: 5-hop
- Green: 10-hop
- Red: 13-hop
- Purple: 16-hop
- Brown: 30-hop
- Dashed black line: Margin = 0
- Vertical dashed lines: Avg. first-hit t* (exact values vary per graph).
### Detailed Analysis
#### R=6 Graph
- **Y-axis range**: -25 to 50.
- **Trends**:
- All lines start near 0 and diverge sharply downward.
- 2-hop (blue) drops steeply, crossing Margin=0 at t≈5.
- Higher hops (e.g., 30-hop, brown) decline more gradually.
- Vertical dashed lines (Avg. first-hit t*) appear near t=3–5.
#### R=7 Graph
- **Y-axis range**: -10 to 20.
- **Trends**:
- Lines start near 0 and decline, with 2-hop (blue) crossing Margin=0 at t≈4.
- 30-hop (brown) remains above Margin=0 until t≈10.
- Avg. first-hit t* marked near t=2–4.
#### R=8 Graph
- **Y-axis range**: -5 to 10.
- **Trends**:
- 2-hop (blue) crosses Margin=0 at t≈3.
- 30-hop (brown) stays positive until t≈8.
- Avg. first-hit t* marked near t=1–3.
#### R=dynamic Graph
- **Y-axis range**: 0 to 10.
- **Trends**:
- Lines converge sharply at t=10, with 30-hop (brown) dropping to Margin=0.
- Avg. first-hit t* marked at t=10.
### Key Observations
1. **Margin Decline**: All configurations show a general decline in Margin with increasing t, but the rate varies by R and hop count.
2. **First-Hit Thresholds**: Avg. first-hit t* occurs earlier for lower R values (e.g., t≈3 for R=8) and later for higher R (e.g., t≈10 for R=dynamic).
3. **Hop Count Impact**: Lower-hop configurations (e.g., 2-hop) reach Margin=0 faster than higher-hop ones (e.g., 30-hop).
4. **Dynamic R Behavior**: The R=dynamic graph shows a sudden convergence at t=10, suggesting a threshold-based adjustment.
### Interpretation
The data suggests that system performance (as measured by Margin) deteriorates with recurrent iterations, but the speed of decline depends on R and hop count. Lower R values and fewer hops lead to faster Margin collapse, while higher R or hop counts delay this effect. The "Avg. first-hit t*" thresholds likely represent critical points where system stability or efficiency thresholds are breached. The R=dynamic configuration’s abrupt change at t=10 implies a mechanism to reset or adjust parameters when Margin approaches zero, preventing further decline. This could indicate adaptive behavior in dynamic systems to maintain performance under varying conditions.