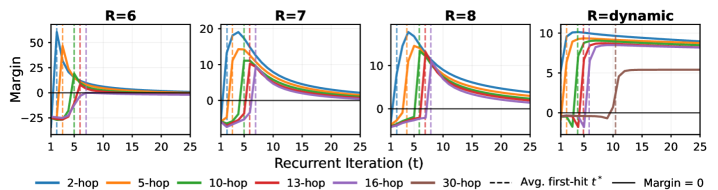
## Heatmap: Recurrent Iteration vs. Margin
### Overview
The heatmap displays the relationship between recurrent iteration (t) and margin (M) for different hop lengths (2-hop, 5-hop, 10-hop, 13-hop, 16-hop, 30-hop) and a dynamic margin setting. The x-axis represents the recurrent iteration, while the y-axis represents the margin.
### Components/Axes
- **X-axis**: Recurrent Iteration (t)
- **Y-axis**: Margin (M)
- **Legend**:
- 2-hop
- 5-hop
- 10-hop
- 13-hop
- 16-hop
- 30-hop
- Avg. first-hit t*
- Margin = 0
### Detailed Analysis or Content Details
The heatmap shows that as the recurrent iteration increases, the margin generally decreases for all hop lengths. The 2-hop and 5-hop lines are the most prominent, showing a steep decline in margin as t increases. The 10-hop, 13-hop, 16-hop, and 30-hop lines show a more gradual decline. The dynamic margin line (dashed line) remains relatively flat, indicating that the margin does not significantly change with increasing recurrent iteration.
### Key Observations
- The 2-hop and 5-hop lines show the most significant decrease in margin as the recurrent iteration increases.
- The dynamic margin line remains relatively flat, indicating minimal change in margin with increasing recurrent iteration.
- The 10-hop, 13-hop, 16-hop, and 30-hop lines show a more gradual decline in margin.
### Interpretation
The heatmap suggests that as the recurrent iteration increases, the margin decreases for all hop lengths. This could indicate that the system becomes less sensitive to changes in margin as the number of iterations increases. The dynamic margin line remaining relatively flat suggests that the system's margin is not significantly affected by changes in the recurrent iteration. This could be due to the system's ability to adapt to changes in the environment or the system's inherent stability.