\n
## Diagram: Rectangular Region Partitioning
### Overview
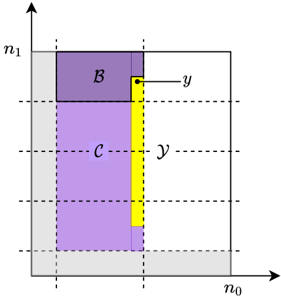
The image depicts a rectangular region partitioned into several areas, likely representing a geometric or mathematical concept. The region is defined by axes labeled *n₀* and *n₁*. Within this region, there are three distinct colored areas: a purple rectangle labeled *B* at the top-left, a larger purple rectangle labeled *C* below *B*, and a yellow rectangle positioned to the right of *C*. Dashed lines indicate boundaries and relationships between the areas. The variable *y* is labeled twice, once at the top-right corner of *B* and once in the middle of the yellow rectangle.
### Components/Axes
* **Axes:**
* *n₀* (horizontal axis)
* *n₁* (vertical axis)
* **Regions:**
* *B* (purple rectangle, top-left)
* *C* (purple rectangle, below *B*)
* Yellow rectangle (right of *C*)
* **Labels:**
* *y* (appears twice, associated with both *B* and the yellow rectangle)
* **Lines:**
* Solid lines defining the rectangular boundaries.
* Dashed lines indicating internal boundaries and potentially relationships between regions.
### Detailed Analysis
The diagram shows a rectangular area with dimensions defined by the axes *n₀* and *n₁*. The purple rectangle *B* is positioned in the upper-left quadrant. Below *B* is a larger purple rectangle *C*. A yellow rectangle is positioned to the right of *C*, sharing a vertical boundary with it. The variable *y* is marked at the top-right corner of *B* and at the center of the yellow rectangle. The dashed lines suggest a possible relationship or partitioning within the overall rectangular area.
There are no numerical values provided on the axes, so precise dimensions or coordinates cannot be determined. The relative sizes of the rectangles can be estimated visually: *C* appears to be approximately twice the height of *B*, and the yellow rectangle's width is roughly comparable to the width of *B*.
### Key Observations
* The diagram focuses on the spatial relationship between the three colored regions.
* The repeated label *y* suggests a common parameter or variable associated with both the purple rectangle *B* and the yellow rectangle.
* The dashed lines imply a partitioning or division of the overall rectangular area.
* The absence of numerical values limits quantitative analysis.
### Interpretation
This diagram likely represents a geometric problem or a visual illustration of a mathematical concept. The partitioning of the rectangular area into regions *B*, *C*, and the yellow rectangle could represent different sets, areas, or quantities. The variable *y* might represent a coordinate, a length, or some other parameter relevant to both the purple rectangle *B* and the yellow rectangle. The dashed lines could indicate boundaries or relationships between these regions, potentially defining constraints or dependencies.
Without additional context, it's difficult to determine the specific meaning of the diagram. However, it appears to be a visual representation of a problem involving areas, boundaries, and a common variable *y*. It could be related to optimization, area calculation, or geometric modeling. The diagram is a qualitative representation, and further information would be needed to perform a quantitative analysis or derive a specific solution.