## Diagram: Partitioned Space with Labeled Regions
### Overview
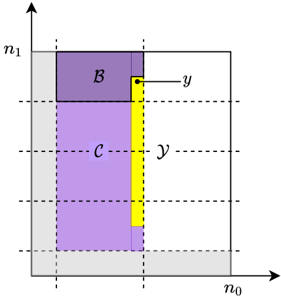
The image depicts a two-dimensional partitioned space divided into three distinct regions labeled **B**, **C**, and **Y**. The diagram uses color coding (purple, light purple, yellow) and spatial positioning to differentiate these regions. A vertical dashed line labeled **Y** separates regions **B** and **C**, while the axes are labeled **n₀** (horizontal) and **n₁** (vertical). The legend is positioned on the right side of the diagram.
---
### Components/Axes
- **Axes**:
- **n₀**: Horizontal axis (x-axis), labeled at the bottom-right corner.
- **n₁**: Vertical axis (y-axis), labeled at the top-left corner.
- Dashed grid lines span the diagram, dividing it into a grid of cells.
- **Regions**:
- **B**: Purple region occupying the top-left quadrant.
- **C**: Light purple region occupying the bottom-left quadrant.
- **Y**: Yellow vertical strip separating **B** and **C**, positioned along the right side of the diagram.
- **Legend**:
- Located on the right side of the diagram.
- Maps colors to labels:
- Purple → **B**
- Light purple → **C**
- Yellow → **Y**
---
### Detailed Analysis
- **Region B**:
- Positioned in the top-left quadrant.
- Bounded by the top edge of the diagram and the vertical line **Y**.
- **Region C**:
- Positioned in the bottom-left quadrant.
- Bounded by the bottom edge of the diagram and the vertical line **Y**.
- **Region Y**:
- A vertical strip spanning the full height of the diagram.
- Acts as a separator between **B** and **C**.
- **Grid Lines**:
- Dashed lines parallel to the axes divide the diagram into a grid of cells.
- No numerical scale is provided for the axes.
---
### Key Observations
1. **Spatial Partitioning**: The diagram explicitly separates the space into three regions using color and a vertical boundary (**Y**).
2. **Legend Consistency**: Colors in the legend (purple, light purple, yellow) match the regions **B**, **C**, and **Y** exactly.
3. **No Numerical Data**: The axes (**n₀**, **n₁**) lack numerical labels or scales, suggesting the diagram is conceptual rather than quantitative.
4. **Dashed Grid**: The grid lines imply a structured partitioning but do not provide measurable intervals.
---
### Interpretation
The diagram illustrates a conceptual partitioning of a two-dimensional space into three distinct regions (**B**, **C**, **Y**). The vertical line **Y** serves as a boundary between **B** and **C**, while the color coding (purple, light purple, yellow) reinforces their separation. The absence of numerical scales on the axes suggests the diagram is intended to represent abstract or categorical divisions rather than quantitative relationships. The legend’s placement on the right ensures clarity in associating colors with labels. This structure could represent hierarchical divisions, resource allocation, or categorical distinctions in a technical or mathematical context.