## Chart: Training Reward and Response Length Trends
### Overview
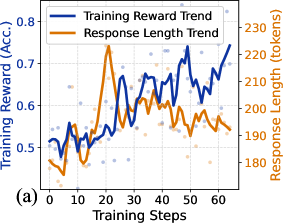
The image presents a line chart showing the trends of "Training Reward" (accuracy) and "Response Length" (tokens) over training steps. The chart includes two y-axes, one for each metric, and a shared x-axis representing training steps. The chart also displays scatter plots behind the lines to show the raw data points.
### Components/Axes
* **Title:** None explicitly present in the image.
* **X-axis:** "Training Steps" ranging from 0 to 60.
* **Left Y-axis:** "Training Reward (Acc.)" ranging from 0.5 to 0.8.
* **Right Y-axis:** "Response Length (tokens)" ranging from 180 to 230.
* **Legend:** Located at the top of the chart.
* "Training Reward Trend" (blue line)
* "Response Length Trend" (orange line)
### Detailed Analysis
* **Training Reward Trend (Blue Line):**
* General Trend: The training reward generally increases over the training steps.
* Initial Value: Starts around 0.52 at step 0.
* Peak Value: Reaches a peak of approximately 0.75 around step 55.
* Final Value: Ends around 0.73 at step 60.
* Fluctuations: The line shows significant fluctuations, indicating variability in the reward at different training steps.
* **Response Length Trend (Orange Line):**
* General Trend: The response length initially decreases, then increases, and finally stabilizes with fluctuations.
* Initial Value: Starts around 200 tokens at step 0.
* Minimum Value: Dips to approximately 180 tokens around step 10.
* Peak Value: Reaches a peak of approximately 220 tokens around step 25.
* Final Value: Stabilizes around 195 tokens at step 60.
* Fluctuations: The line shows significant fluctuations, indicating variability in the response length at different training steps.
* **Scatter Plots:**
* Blue dots represent individual data points for the training reward.
* Orange dots represent individual data points for the response length.
* The scatter plots show the distribution of the raw data points around the trend lines.
### Key Observations
* The training reward generally increases with training steps, indicating improved model performance.
* The response length initially decreases and then fluctuates, suggesting changes in the model's output behavior.
* The fluctuations in both trends indicate variability in the training process.
* The scatter plots provide additional information about the distribution of the data points around the trend lines.
### Interpretation
The chart illustrates the relationship between training reward (accuracy) and response length (tokens) during the training process. The increasing training reward suggests that the model is learning and improving its performance over time. The fluctuating response length indicates that the model's output behavior is changing during training. The initial decrease in response length might be due to the model learning to generate more concise responses, while the subsequent fluctuations could be due to changes in the training data or model parameters. The scatter plots provide additional information about the distribution of the data points, which can be useful for understanding the variability in the training process. Overall, the chart provides insights into the dynamics of the training process and the relationship between model performance and output behavior.