TECHNICAL ASSET FINGERPRINT
c4a463b1a0d3fc98a977045a
Click to view fullscreen
Press ESC or click to close
FOUND IN PAPERS
EXPERT: gemini-2.5-flash-free VERSION 1
RUNTIME: google-free/gemini-2.5-flash
INTEL_VERIFIED
## Chart Type: Dual Y-Axis Line Chart with Scatter Points: Training Reward and Response Length Trends
### Overview
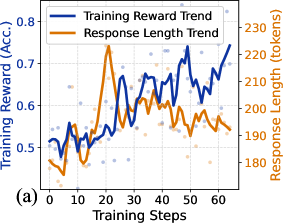
This image displays a dual y-axis line chart illustrating the trends of "Training Reward (Acc.)" and "Response Length (tokens)" over "Training Steps". Both metrics are shown with smoothed trend lines and underlying scatter points representing individual data observations. The chart provides insights into how a model's performance (reward/accuracy) and output verbosity (response length) evolve during a training process.
### Components/Axes
The chart is structured with a horizontal x-axis at the bottom and two vertical y-axes, one on the left and one on the right. A legend is positioned at the top-center. A label "(a)" is present at the bottom-left corner.
* **X-axis (Bottom-Center):**
* **Label:** "Training Steps"
* **Range:** From 0 to approximately 65.
* **Major Ticks:** 0, 10, 20, 30, 40, 50, 60.
* **Minor Ticks:** Every 5 steps.
* **Left Y-axis (Left-Middle):**
* **Label:** "Training Reward (Acc.)"
* **Unit:** "(Acc.)" (likely representing Accuracy)
* **Range:** From approximately 0.45 to 0.8.
* **Major Ticks:** 0.5, 0.6, 0.7, 0.8.
* **Minor Ticks:** Every 0.05.
* **Right Y-axis (Right-Middle):**
* **Label:** "Response Length (tokens)"
* **Unit:** "(tokens)"
* **Range:** From approximately 170 to 230.
* **Major Ticks:** 170, 180, 190, 200, 210, 220, 230.
* **Minor Ticks:** Every 5 tokens.
* **Legend (Top-Center):**
* A rectangular box containing two entries:
* **Dark Blue Line:** "Training Reward Trend"
* **Orange Line:** "Response Length Trend"
### Detailed Analysis
The chart presents two primary data series, each with a trend line and corresponding scatter points.
1. **Training Reward Trend (Dark Blue Line and Light Blue/Purple Scatter Points):**
* **Visual Trend:** The dark blue line generally shows an upward trend, indicating an improvement in training reward over time, despite significant fluctuations. It starts lower, experiences a dip, then rises, fluctuates, and ends at a higher value.
* **Approximate Data Points:**
* At Training Step 0: ~0.52
* At Training Step 5: ~0.55
* At Training Step 10: ~0.50
* At Training Step 15: ~0.54
* At Training Step 20: ~0.55
* At Training Step 25: ~0.66 (local peak)
* At Training Step 30: ~0.58
* At Training Step 35: ~0.67
* At Training Step 40: ~0.62
* At Training Step 45: ~0.65
* At Training Step 50: ~0.73 (highest peak)
* At Training Step 55: ~0.63
* At Training Step 60: ~0.68
* At Training Step 65: ~0.75
* **Scatter Points:** Light blue/purple dots are distributed around the dark blue trend line, representing individual training reward values at various steps. They show a wider spread in the earlier steps and appear to cluster more closely around the trend line as training progresses.
2. **Response Length Trend (Orange Line and Light Orange Scatter Points):**
* **Visual Trend:** The orange line exhibits more volatility, particularly in the initial steps. It shows an initial increase, peaks around Training Step 20, then generally decreases and stabilizes with ongoing fluctuations towards the end of the training steps.
* **Approximate Data Points:**
* At Training Step 0: ~185 tokens
* At Training Step 5: ~178 tokens
* At Training Step 10: ~185 tokens
* At Training Step 15: ~190 tokens
* At Training Step 20: ~220 tokens (highest peak)
* At Training Step 25: ~205 tokens
* At Training Step 30: ~195 tokens
* At Training Step 35: ~205 tokens
* At Training Step 40: ~200 tokens
* At Training Step 45: ~190 tokens
* At Training Step 50: ~195 tokens
* At Training Step 55: ~190 tokens
* At Training Step 60: ~195 tokens
* At Training Step 65: ~190 tokens
* **Scatter Points:** Light orange dots are scattered around the orange trend line, representing individual response length values. These points show a significant spread, especially around the peak at Training Step 20, indicating variability in response length.
### Key Observations
* The "Training Reward Trend" (blue) generally improves from approximately 0.52 to 0.75 over 65 training steps, indicating positive learning.
* The "Response Length Trend" (orange) shows an initial surge, peaking at around 220 tokens at Training Step 20, then gradually decreases and stabilizes around 190-195 tokens by the end.
* There appears to be an interesting relationship between the two trends: the peak in "Response Length" around Training Step 20-25 coincides with the "Training Reward" beginning a more consistent upward trajectory after an initial plateau.
* Both metrics exhibit considerable fluctuations throughout the training process, suggesting dynamic and non-linear learning behavior.
* The scatter points provide a visual representation of the raw data variability, showing that the trend lines are smoothed averages of these fluctuating individual observations.
### Interpretation
This chart suggests a typical learning trajectory for a model, likely in a generative task where both performance (reward/accuracy) and output characteristics (response length) are monitored.
The initial phase (0-20 training steps) shows the model exploring its output space, as indicated by the increasing "Response Length Trend" which peaks around step 20. During this exploration, the "Training Reward" remains relatively stable or shows minor fluctuations, possibly because the model is still learning to generate coherent or relevant outputs, even if they are longer.
A critical point appears around Training Step 20-25. As the "Response Length" begins to decrease from its peak, the "Training Reward" starts a more pronounced and consistent upward climb. This could imply that:
1. The model initially learns to generate more verbose responses, perhaps to cover all possibilities or to avoid brevity penalties.
2. Subsequently, it learns to refine its responses, becoming more efficient and concise (reducing length) while simultaneously improving the quality or accuracy of those responses (increasing reward). This suggests that the model might be pruning unnecessary tokens or finding more optimal ways to convey information.
3. The initial phase of generating longer responses might be a necessary exploration step that lays the groundwork for later accuracy improvements. The model might first learn *what* to say (leading to longer responses) and then *how* to say it more effectively (leading to shorter, more accurate responses).
The continuous fluctuations in both trends are common in iterative training processes, often due to batch processing, stochastic gradient descent, or dynamic learning rates. However, the overall positive trend in "Training Reward" and the stabilization of "Response Length" at a more moderate level indicate successful learning and refinement of the model's output generation capabilities. The data demonstrates that higher accuracy does not necessarily correlate with longer responses; in fact, the model seems to achieve better performance with more optimized, potentially shorter, outputs after an initial exploratory phase.
DECODING INTELLIGENCE...