\n
## Line Chart: Training Reward and Response Length Trend
### Overview
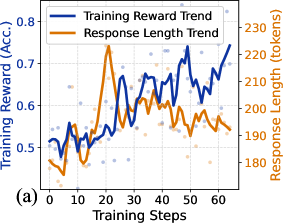
This image presents a line chart illustrating the trends of "Training Reward" and "Response Length" over "Training Steps". The chart displays two distinct lines, each representing one of the tracked metrics, plotted against the number of training steps. A secondary y-axis is present on the right side of the chart to display the Response Length.
### Components/Axes
* **X-axis:** "Training Steps" ranging from 0 to 60, with tick marks at intervals of 10.
* **Y-axis (left):** "Training Reward (Acc.)" ranging from approximately 0.45 to 0.8, with tick marks at intervals of 0.1.
* **Y-axis (right):** "Response Length (tokens)" ranging from approximately 180 to 230, with tick marks at intervals of 10.
* **Legend (top-left):**
* Blue Line: "Training Reward Trend"
* Orange Line: "Response Length Trend"
* **Label (bottom-left):** "(a)" - likely a figure identifier.
* **Data Points:** Numerous small grey dots are scattered throughout the chart, representing individual data points for both metrics.
### Detailed Analysis
**Training Reward Trend (Blue Line):**
The blue line generally slopes upward, indicating an increasing training reward as the number of training steps increases.
* At Training Step 0, the Training Reward is approximately 0.51.
* At Training Step 10, the Training Reward is approximately 0.62.
* At Training Step 20, the Training Reward is approximately 0.67.
* At Training Step 30, the Training Reward is approximately 0.71.
* At Training Step 40, the Training Reward is approximately 0.68.
* At Training Step 50, the Training Reward is approximately 0.73.
* At Training Step 60, the Training Reward is approximately 0.77.
There are fluctuations in the trend, with dips around Training Steps 35 and 45.
**Response Length Trend (Orange Line):**
The orange line shows a generally decreasing trend in response length, with some fluctuations.
* At Training Step 0, the Response Length is approximately 215 tokens.
* At Training Step 10, the Response Length is approximately 225 tokens.
* At Training Step 20, the Response Length is approximately 210 tokens.
* At Training Step 30, the Response Length is approximately 205 tokens.
* At Training Step 40, the Response Length is approximately 195 tokens.
* At Training Step 50, the Response Length is approximately 200 tokens.
* At Training Step 60, the Response Length is approximately 190 tokens.
There is a peak around Training Step 10.
### Key Observations
* The Training Reward generally increases with training steps, while the Response Length generally decreases.
* The fluctuations in both lines suggest that the training process is not perfectly smooth.
* The initial increase in Response Length at the beginning of training is notable.
* The scales of the two y-axes are different, indicating that the metrics are measured in different units and have different ranges.
### Interpretation
The chart suggests that as the model is trained (increasing Training Steps), it becomes more accurate (increasing Training Reward) and generates shorter responses (decreasing Response Length). This could indicate that the model is learning to provide more concise and relevant answers. The fluctuations in both metrics suggest that the training process is dynamic and may require further optimization. The initial increase in response length could be due to the model exploring different response strategies early in training, before converging on more efficient ones. The relationship between the two trends is interesting; it's possible that the model is learning to achieve higher rewards by being more concise, or that the reduction in response length is a side effect of improving the model's accuracy. Further analysis would be needed to determine the exact nature of this relationship.