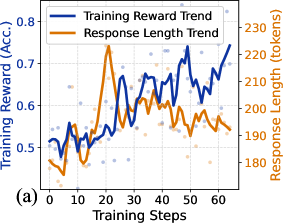
## Line Chart: Training Reward vs. Response Length Trends
### Overview
The chart visualizes two interrelated trends during a machine learning model's training process:
1. **Training Reward (Accuracy)** (blue line and data points)
2. **Response Length (tokens)** (orange line and data points)
Both metrics are plotted against **Training Steps** (x-axis), showing dynamic changes over 60 training iterations.
---
### Components/Axes
- **X-axis (Horizontal)**:
- Label: "Training Steps"
- Scale: 0 to 60 (discrete increments)
- Position: Bottom of the chart
- **Y-axis (Left)**:
- Label: "Training Reward (Acc.)"
- Scale: 0.4 to 0.8 (accuracy values)
- Position: Left edge
- **Y-axis (Right)**:
- Label: "Response Length (tokens)"
- Scale: 180 to 230 (token counts)
- Position: Right edge
- **Legend**:
- Position: Top-left corner
- Entries:
- Blue line: "Training Reward Trend"
- Orange line: "Response Length Trend"
- **Data Points**:
- Blue dots: Scattered around the blue line (Training Reward)
- Orange dots: Scattered around the orange line (Response Length)
---
### Detailed Analysis
#### Training Reward Trend (Blue)
- **Initial Phase (Steps 0–10)**:
- Starts at ~0.52 accuracy, dips to ~0.48 at step 5, then rises to ~0.55 by step 10.
- **Mid-Phase (Steps 10–40)**:
- Peaks at ~0.75 at step 20, followed by oscillations between ~0.6 and ~0.7.
- Final value at step 60: ~0.78.
- **Trend**: Overall upward trajectory with volatility.
#### Response Length Trend (Orange)
- **Initial Phase (Steps 0–10)**:
- Begins at ~190 tokens, drops to ~185 at step 5, then rises to ~200 by step 10.
- **Mid-Phase (Steps 10–40)**:
- Peaks at ~230 tokens at step 20, then declines to ~200 by step 40.
- **Final Phase (Steps 40–60)**:
- Stabilizes between ~195–205 tokens.
- **Trend**: Initial increase followed by stabilization.
#### Data Point Variability
- Blue/orange dots show ±0.05–±5 token variability around the lines, indicating measurement noise or batch-specific fluctuations.
---
### Key Observations
1. **Peak Correlation**: Both metrics peak at **step 20**, suggesting a temporary surge in model complexity (longer responses) alongside improved reward.
2. **Divergence Post-Peak**:
- Training Reward continues improving after step 20, while Response Length declines.
- This implies the model becomes more efficient (shorter responses) without sacrificing performance.
3. **Stability**: By step 60, both metrics stabilize, indicating convergence.
---
### Interpretation
- **Training Dynamics**:
The initial peak in response length (step 20) may reflect the model exploring complex patterns, while the subsequent decline in response length suggests optimization toward concise, effective outputs.
- **Reward-Response Relationship**:
The positive correlation between reward and response length early in training (steps 0–20) hints that longer responses might initially capture more context. However, the decoupling post-step 20 indicates the model learns to balance brevity and accuracy.
- **Practical Implications**:
The stabilization at step 60 suggests the model has reached a stable state, making it suitable for deployment. The final accuracy (~0.78) and response length (~200 tokens) provide a benchmark for similar tasks.
**Note**: The chart does not explicitly state the dataset or model architecture, limiting conclusions about generalizability.