## Bar Chart: Refused to Answer (%)
### Overview
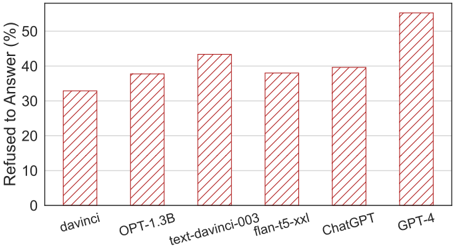
The chart displays the percentage of responses where various AI models refused to answer. The y-axis represents the refusal rate (0–50%), while the x-axis lists six AI models: davinci, OPT-1.3B, text-davinci-003, flan-t5-xxl, ChatGPT, and GPT-4. All bars use a red diagonal stripe pattern to denote the "Refused to Answer (%)" category.
### Components/Axes
- **Y-Axis**: "Refused to Answer (%)" with increments of 10% (0–50%).
- **X-Axis**: AI model names (davinci, OPT-1.3B, text-davinci-003, flan-t5-xxl, ChatGPT, GPT-4).
- **Legend**: Located on the right, labeled "Refused to Answer (%)" with a red diagonal stripe pattern.
- **Bars**: Positioned horizontally, with heights proportional to refusal rates.
### Detailed Analysis
- **davinci**: ~32% refusal rate (shortest bar).
- **OPT-1.3B**: ~38% refusal rate.
- **text-davinci-003**: ~43% refusal rate (second tallest).
- **flan-t5-xxl**: ~38% refusal rate (matches OPT-1.3B).
- **ChatGPT**: ~40% refusal rate.
- **GPT-4**: ~55% refusal rate (tallest bar, exceeding y-axis maximum).
### Key Observations
1. **GPT-4** has the highest refusal rate (~55%), significantly surpassing other models.
2. **text-davinci-003** and **ChatGPT** show mid-to-high refusal rates (~40–43%).
3. **davinci**, **OPT-1.3B**, and **flan-t5-xxl** have lower refusal rates (~32–38%).
4. The y-axis maximum (50%) is exceeded by GPT-4, suggesting potential data truncation or scaling limitations.
### Interpretation
The data suggests that larger or more advanced models (e.g., GPT-4, text-davinci-003) may exhibit higher refusal rates, possibly due to stricter safety protocols or complex decision-making processes. However, **flan-t5-xxl** (a large model) deviates from this trend, indicating that model architecture or training objectives might influence refusal behavior. The outlier in GPT-4’s refusal rate could reflect its cutting-edge design prioritizing cautious responses. The chart highlights a correlation between model sophistication and refusal tendencies, though exceptions like flan-t5-xxl warrant further investigation.