## Bar Chart: Refused to Answer Rate for Different Language Models
### Overview
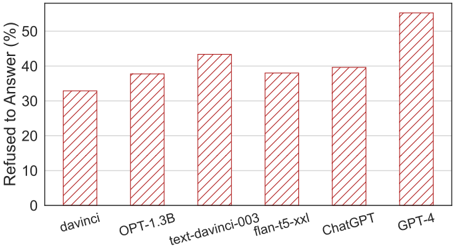
The image is a bar chart comparing the percentage of times different language models refused to answer a question. The x-axis lists the language models, and the y-axis represents the percentage of refusals.
### Components/Axes
* **X-axis:** Language Models (davinci, OPT-1.3B, text-davinci-003, flan-t5-xxl, ChatGPT, GPT-4)
* **Y-axis:** Refused to Answer (%) - Scale from 0 to 50 in increments of 10.
* **Bars:** Each bar represents a language model. The height of the bar indicates the percentage of times the model refused to answer. The bars are filled with a red diagonal hatch pattern.
### Detailed Analysis
* **davinci:** Refused to answer approximately 33%.
* **OPT-1.3B:** Refused to answer approximately 38%.
* **text-davinci-003:** Refused to answer approximately 43%.
* **flan-t5-xxl:** Refused to answer approximately 39%.
* **ChatGPT:** Refused to answer approximately 40%.
* **GPT-4:** Refused to answer approximately 53%.
### Key Observations
* GPT-4 has the highest refusal rate, significantly higher than the other models.
* davinci has the lowest refusal rate among the models tested.
* The refusal rates for OPT-1.3B, text-davinci-003, flan-t5-xxl, and ChatGPT are relatively close to each other, ranging from approximately 38% to 43%.
### Interpretation
The chart suggests that different language models have varying tendencies to refuse answering questions. GPT-4 appears to be more cautious or restricted in its responses compared to the other models, leading to a higher refusal rate. davinci, on the other hand, seems to be more willing to provide answers, resulting in the lowest refusal rate. The other models exhibit intermediate levels of refusal. This could be due to differences in training data, safety protocols, or model architecture.