## Bar Chart: MLE-bench (AIDE) Performance Comparison
### Overview
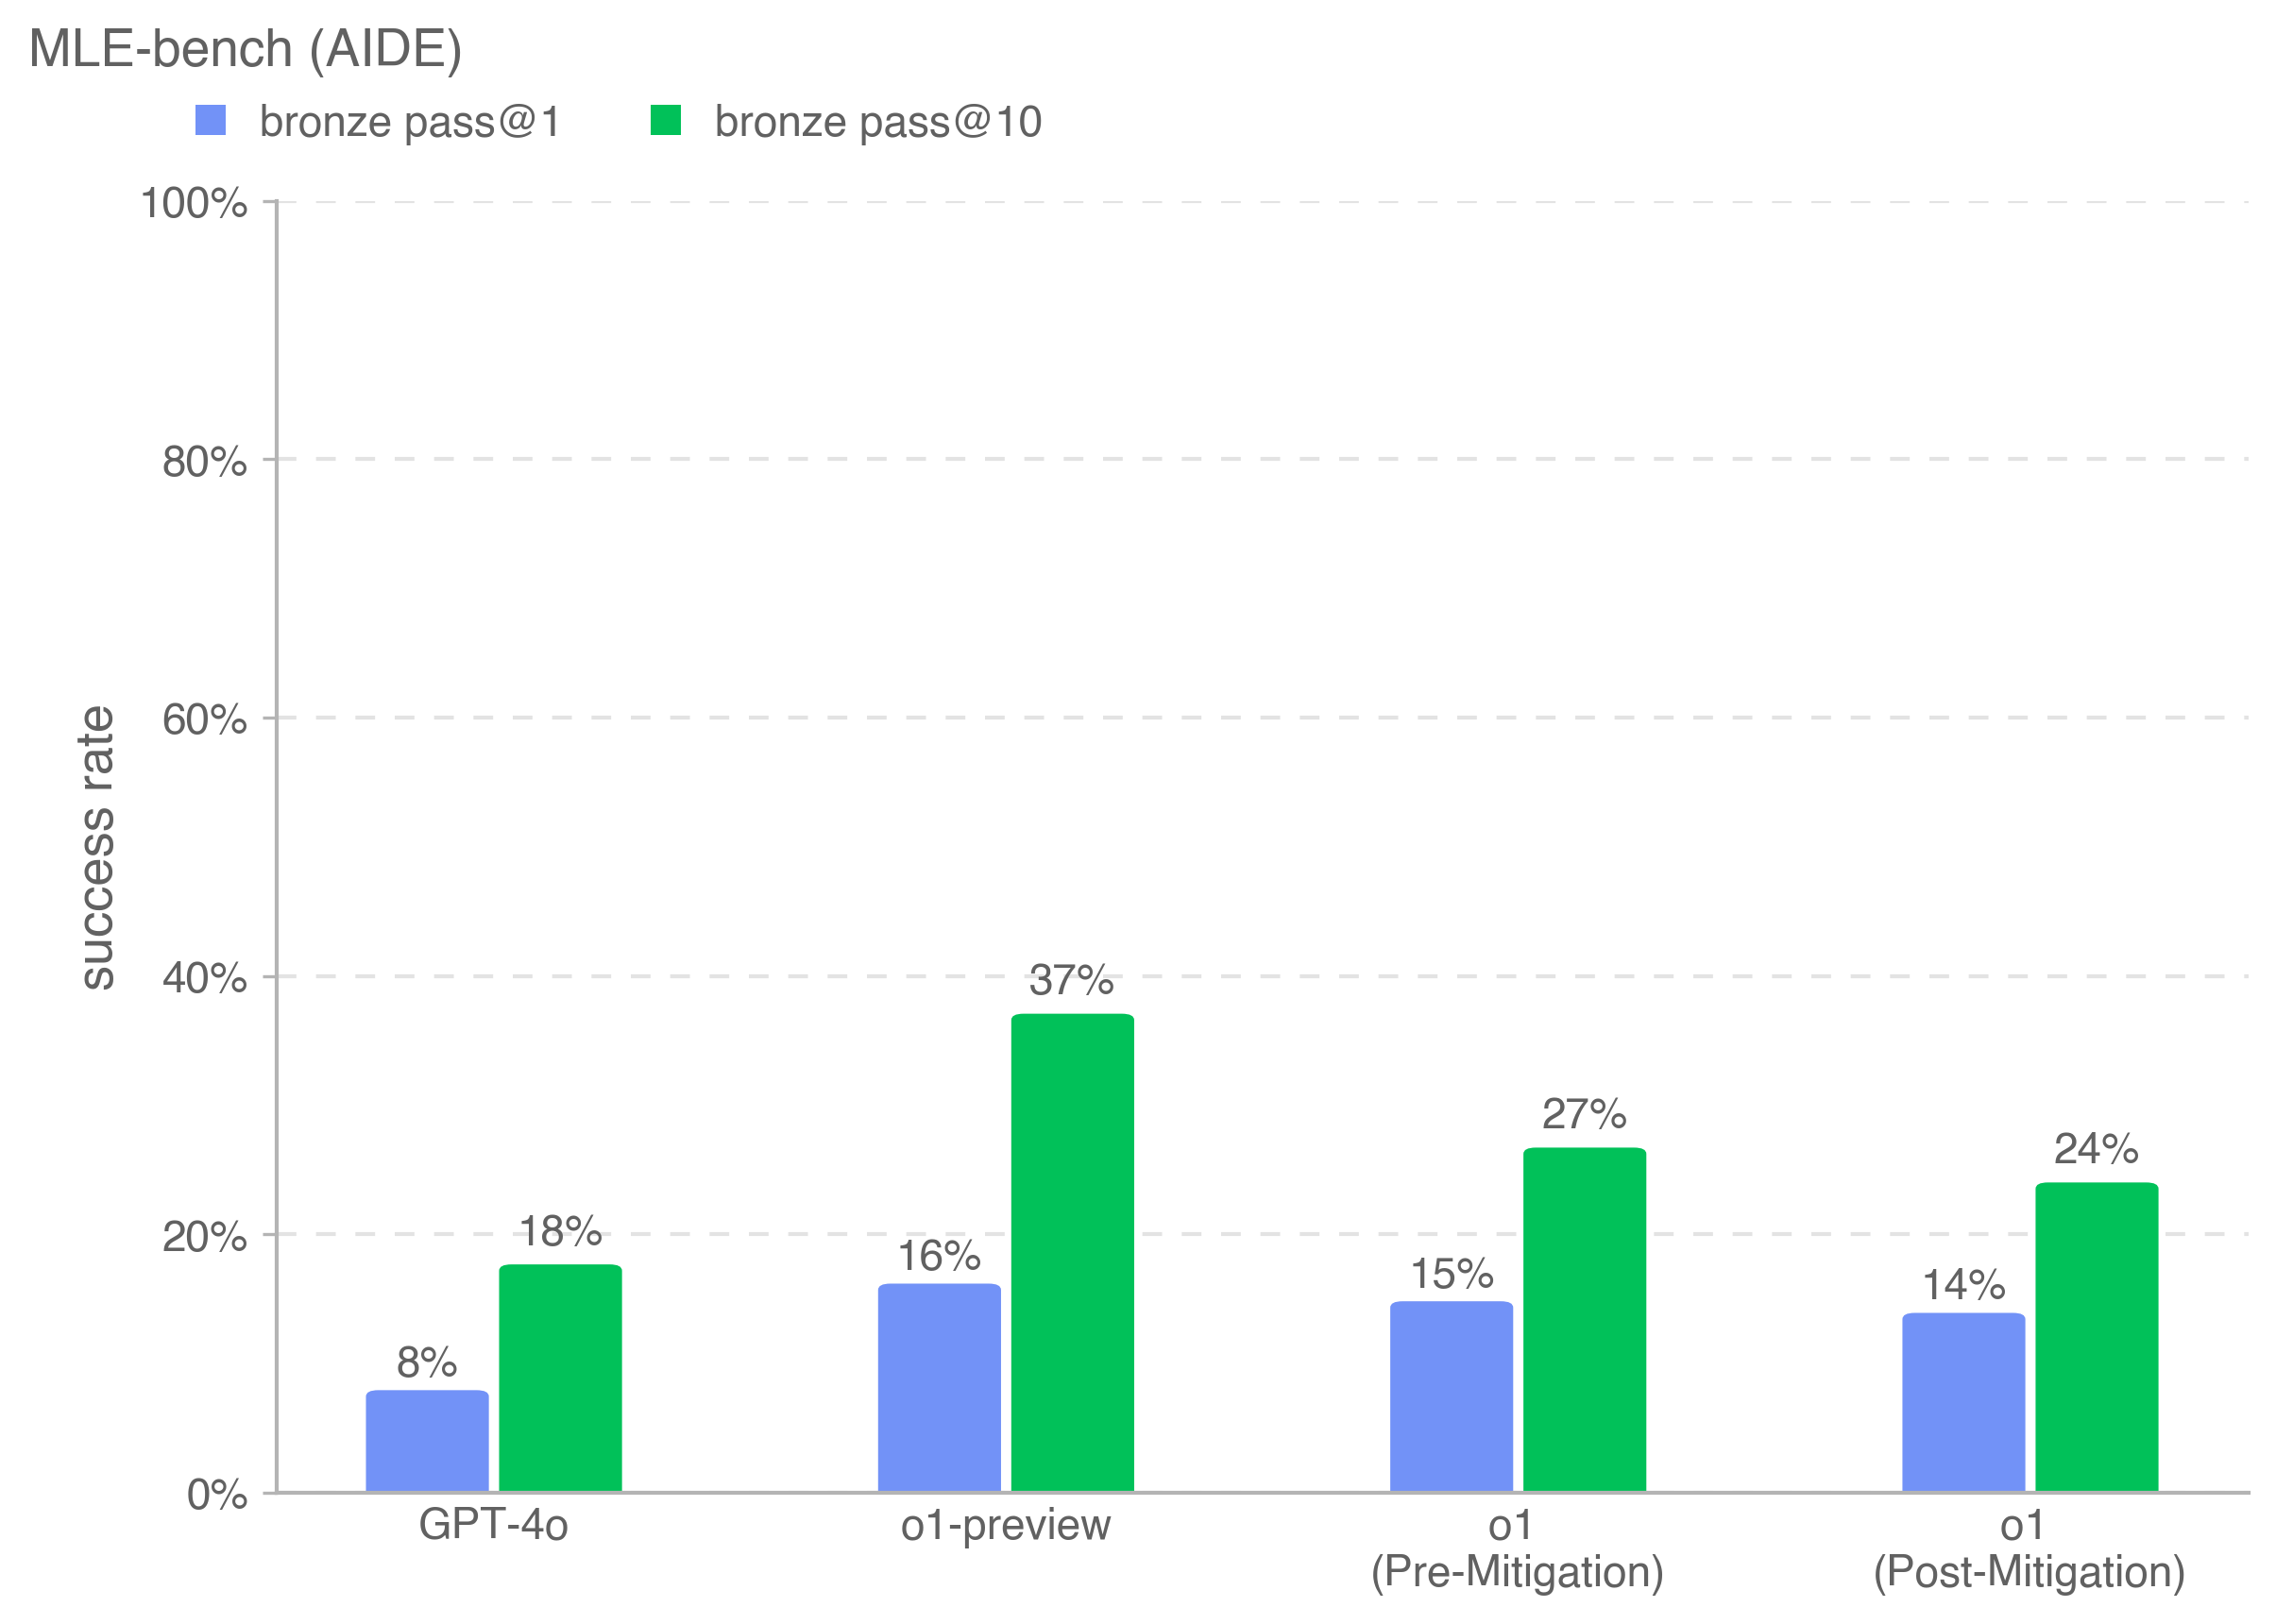
The chart compares success rates for different AI models across two evaluation metrics: "bronze pass@1" (blue bars) and "bronze pass@10" (green bars). Four categories are analyzed: GPT-4o, o1-preview, o1 (Pre-Mitigation), and o1 (Post-Mitigation). Success rates are measured on a 0%-100% scale.
### Components/Axes
- **X-axis**: Model categories (GPT-4o, o1-preview, o1 (Pre-Mitigation), o1 (Post-Mitigation))
- **Y-axis**: Success rate (0% to 100%, labeled "success rate")
- **Legend**:
- Blue square: bronze pass@1
- Green square: bronze pass@10
- **Placement**: Legend in top-left corner; bars grouped by model with blue/left and green/right alignment.
### Detailed Analysis
1. **GPT-4o**:
- bronze pass@1: ~8% (blue bar)
- bronze pass@10: ~18% (green bar)
2. **o1-preview**:
- bronze pass@1: ~16% (blue bar)
- bronze pass@10: ~37% (green bar)
3. **o1 (Pre-Mitigation)**:
- bronze pass@1: ~15% (blue bar)
- bronze pass@10: ~27% (green bar)
4. **o1 (Post-Mitigation)**:
- bronze pass@1: ~14% (blue bar)
- bronze pass@10: ~24% (green bar)
### Key Observations
- **Metric Consistency**: bronze pass@10 consistently exceeds bronze pass@1 across all models (e.g., GPT-4o: 8% vs. 18%).
- **Model Performance**: o1-preview achieves the highest success rates (37% for bronze pass@10), while GPT-4o has the lowest (8% for bronze pass@1).
- **Mitigation Impact**: o1's Post-Mitigation shows reduced success rates compared to Pre-Mitigation (bronze pass@1: 15% → 14%; bronze pass@10: 27% → 24%).
### Interpretation
The data demonstrates that increasing the evaluation threshold (from 1 to 10 bronze passes) improves success rates across all models, suggesting that stricter criteria correlate with higher performance validation. The o1-preview model outperforms others significantly, indicating superior mitigation strategies or architectural advantages. The Post-Mitigation phase for o1 introduces a performance decline, potentially reflecting over-optimization or unintended consequences of mitigation adjustments. These trends highlight trade-offs between evaluation granularity and model robustness.