## Bar Chart: MLE-bench (AIDE) Success Rate
### Overview
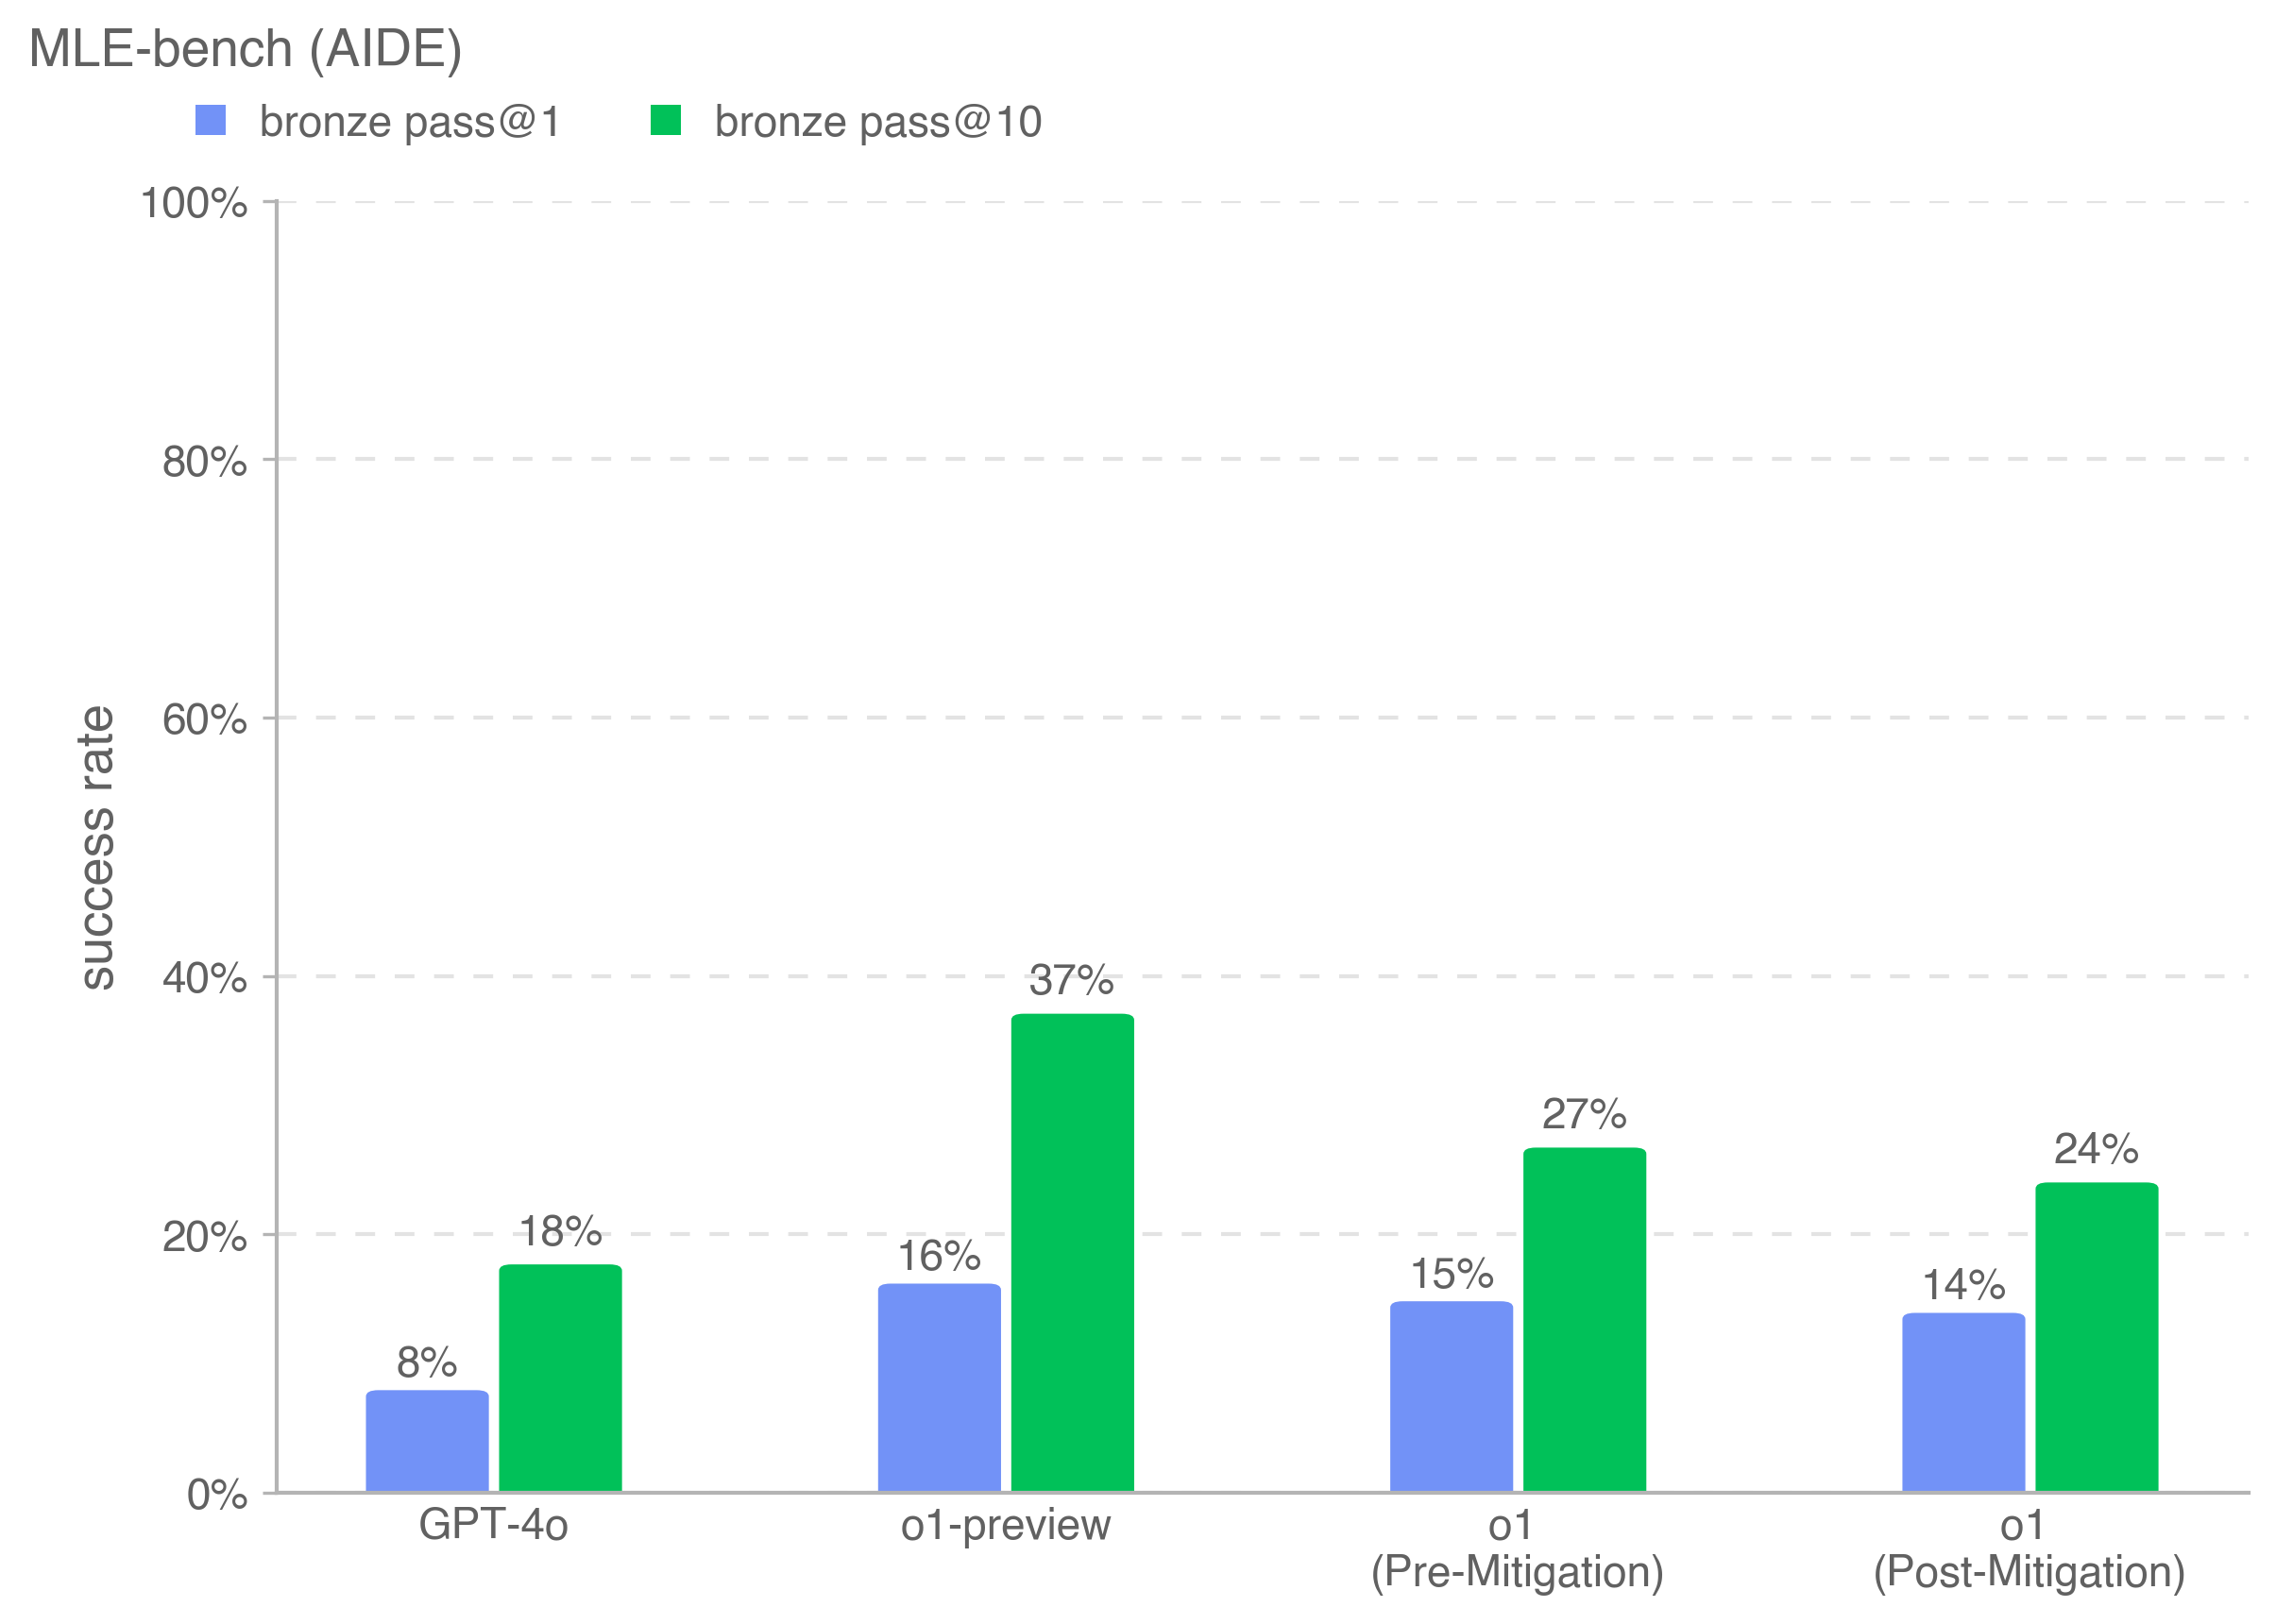
The image is a bar chart comparing the success rates of different models (GPT-4o, o1-preview, o1 Pre-Mitigation, o1 Post-Mitigation) on the MLE-bench (AIDE) benchmark. The chart displays success rates for "bronze pass@1" and "bronze pass@10".
### Components/Axes
* **Title:** MLE-bench (AIDE)
* **Y-axis:** "success rate", ranging from 0% to 100% in increments of 20%.
* **X-axis:** Categorical axis with the following categories:
* GPT-4o
* o1-preview
* o1 (Pre-Mitigation)
* o1 (Post-Mitigation)
* **Legend:** Located at the top of the chart.
* Blue square: "bronze pass@1"
* Green square: "bronze pass@10"
### Detailed Analysis
The chart presents success rates for each model and pass type.
* **GPT-4o:**
* bronze pass@1: 8%
* bronze pass@10: 18%
* **o1-preview:**
* bronze pass@1: 16%
* bronze pass@10: 37%
* **o1 (Pre-Mitigation):**
* bronze pass@1: 15%
* bronze pass@10: 27%
* **o1 (Post-Mitigation):**
* bronze pass@1: 14%
* bronze pass@10: 24%
### Key Observations
* For all models, the "bronze pass@10" success rate is higher than the "bronze pass@1" success rate.
* o1-preview has the highest success rates for both "bronze pass@1" and "bronze pass@10".
* The mitigation efforts on 'o1' appear to have slightly decreased the success rate for both pass types.
### Interpretation
The chart indicates that the o1-preview model performs best on the MLE-bench (AIDE) benchmark, achieving the highest success rates for both bronze pass criteria. The mitigation applied to the 'o1' model resulted in a slight decrease in performance. The difference between "bronze pass@1" and "bronze pass@10" suggests that allowing more attempts (10 vs. 1) significantly improves the success rate across all models.