\n
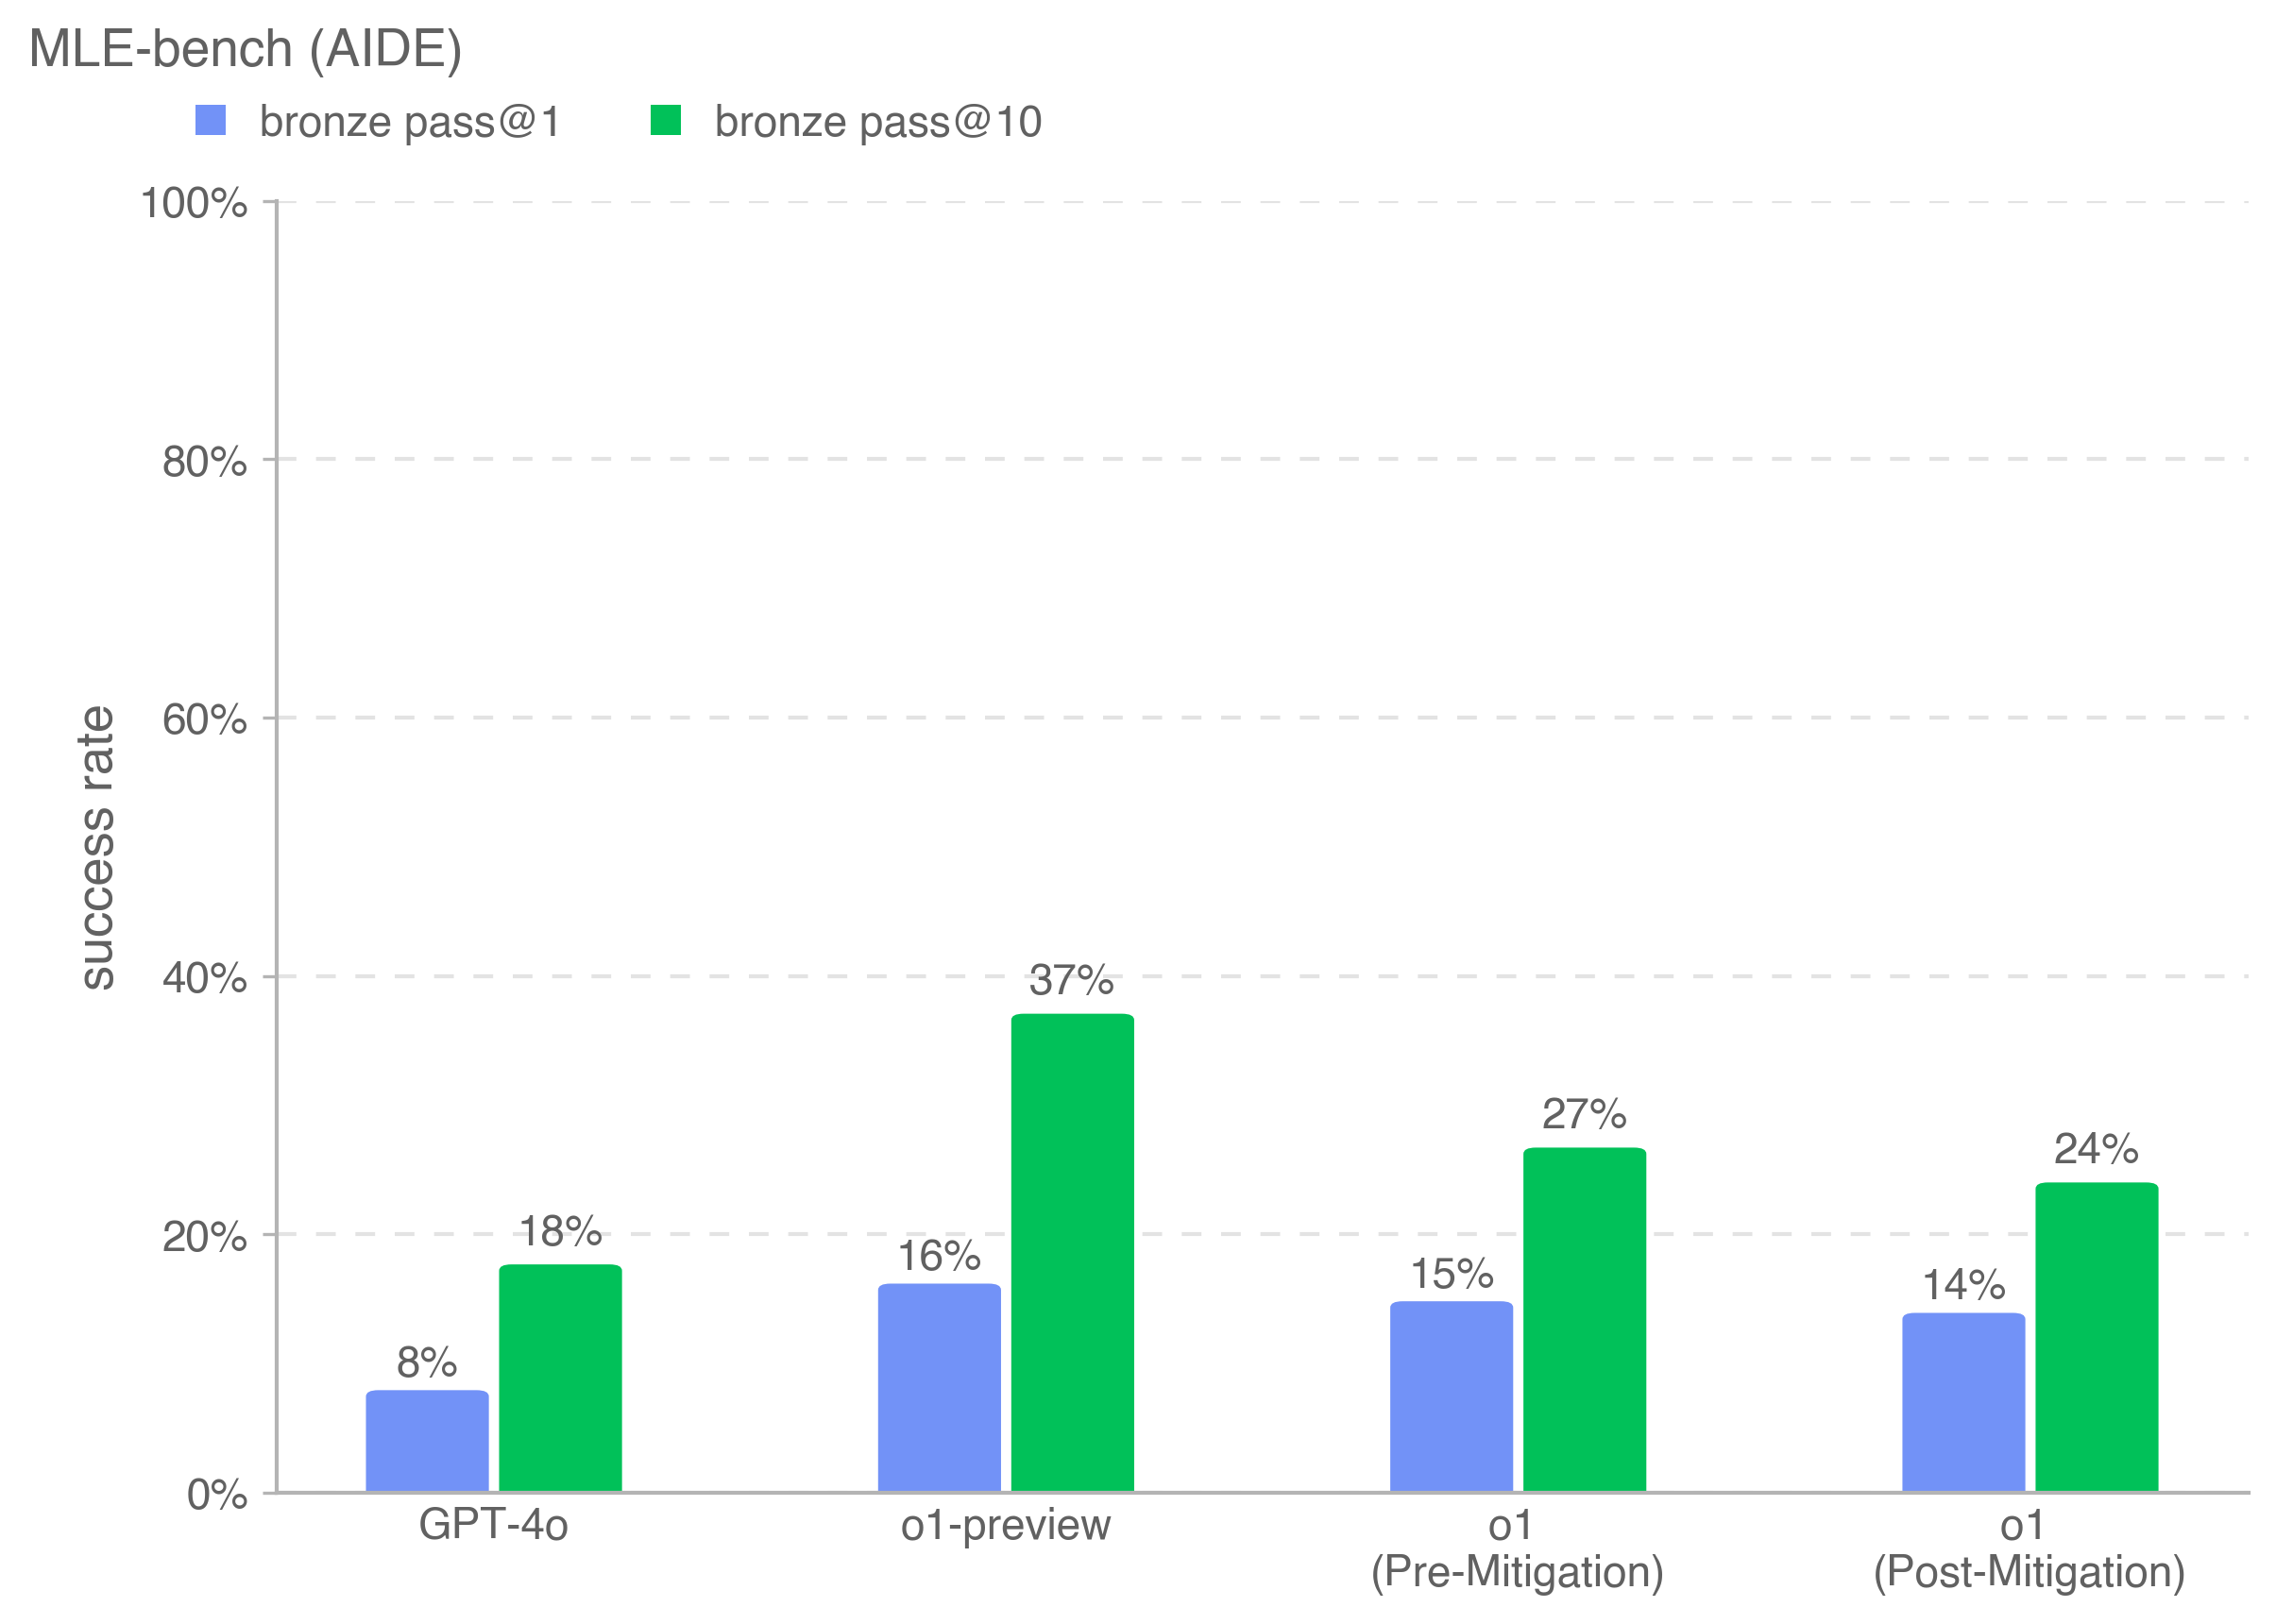
## Bar Chart: MLE-bench (AIDE) Success Rates
### Overview
This is a grouped bar chart comparing the performance of four different AI models on the "MLE-bench (AIDE)" benchmark. The chart measures "success rate" as a percentage, comparing two different evaluation metrics ("bronze pass@1" and "bronze pass@10") for each model.
### Components/Axes
* **Chart Title:** "MLE-bench (AIDE)" (located at the top-left).
* **Y-Axis:** Labeled "success rate". The scale runs from 0% to 100% in increments of 20%, with horizontal grid lines at each increment.
* **X-Axis:** Lists four model categories:
1. GPT-4o
2. o1-preview
3. o1 (Pre-Mitigation)
4. o1 (Post-Mitigation)
* **Legend:** Positioned at the top-left, below the title.
* A blue square corresponds to "bronze pass@1".
* A green square corresponds to "bronze pass@10".
### Detailed Analysis
The chart displays paired bars for each model. The left (blue) bar represents the "bronze pass@1" success rate, and the right (green) bar represents the "bronze pass@10" success rate.
**Data Points (Approximate Values):**
1. **GPT-4o:**
* bronze pass@1 (Blue): 8%
* bronze pass@10 (Green): 18%
2. **o1-preview:**
* bronze pass@1 (Blue): 16%
* bronze pass@10 (Green): 37%
3. **o1 (Pre-Mitigation):**
* bronze pass@1 (Blue): 15%
* bronze pass@10 (Green): 27%
4. **o1 (Post-Mitigation):**
* bronze pass@1 (Blue): 14%
* bronze pass@10 (Green): 24%
**Trend Verification:**
* For every model, the green bar ("pass@10") is taller than the blue bar ("pass@1"), indicating a consistent improvement in success rate when allowing for 10 attempts versus a single attempt.
* The model "o1-preview" has the tallest bars for both metrics.
* Comparing "o1 (Pre-Mitigation)" to "o1 (Post-Mitigation)", both the blue and green bars show a slight decrease in height.
### Key Observations
* **Highest Performance:** The "o1-preview" model achieves the highest success rates on this benchmark: 16% for pass@1 and 37% for pass@10.
* **Impact of Multiple Attempts:** The "pass@10" metric yields significantly higher success rates than "pass@1" for all models, with the gap being most pronounced for "o1-preview" (a 21 percentage point difference).
* **Effect of Mitigation:** The "o1" model shows a decrease in performance after mitigation. The pass@1 rate drops from 15% to 14%, and the pass@10 rate drops from 27% to 24%.
* **Baseline Comparison:** "GPT-4o" has the lowest scores among the four models presented.
### Interpretation
This chart evaluates AI model performance on a machine learning engineering benchmark (MLE-bench). The "bronze pass@k" metric likely measures the probability of achieving at least a "bronze" level solution within `k` attempts.
The data suggests that the "o1-preview" model is the most capable on this specific task set. The consistent and substantial increase from pass@1 to pass@10 across all models indicates that these problems often require multiple attempts or refinements to solve, and the models benefit from the opportunity to generate several solutions.
The comparison between "o1 (Pre-Mitigation)" and "o1 (Post-Mitigation)" is particularly noteworthy. It implies that the "mitigation" process applied to the o1 model, while potentially addressing other concerns (like safety or bias), may have resulted in a slight trade-off in raw performance on this technical benchmark. This highlights a potential tension between model alignment/safety interventions and task-specific capability.